33
/es/
AIzaSyAYiBZKx7MnpbEhh9jyipgxe19OcubqV5w
August 1, 2025
197632
Moldova
MDA
true
2
1
Gross value added at factor cost (current LCU)
2016,2015,2014,2013,2012,2011,2010,2009,2008,2007,2006,2005,2004,2003,2002,2001,2000,1999,1998,1997,1996
Download
Estadísticas Globales de la Biblioteca →Moldova →

Gross value added at factor cost (current LCU)

Estas estadísticas en otros países:

AfghanistanAlbaniaAlgeriaAndorraAntigua and BarbudaArgentinaArmeniaArubaAustraliaAustriaAzerbaijanBahamas, TheBahrainBangladeshBarbadosBelarusBelgiumBelizeBeninBermudaBhutanBoliviaBosnia and HerzegovinaBotswanaBrazilBulgariaBurkina FasoBurundiCabo VerdeCambodiaCameroonCanadaCayman IslandsCentral African RepublicChadChileColombiaCongo, Dem. Rep.Costa RicaCroatiaCubaCyprusCzech RepublicDenmarkDjiboutiDominicaDominican RepublicEcuadorEgypt, Arab Rep.El SalvadorEquatorial GuineaEritreaEstoniaEthiopiaFaroe IslandsFijiFinlandFranceGabonGambia, TheGeorgiaGermanyGhanaGreeceGrenadaGuatemalaGuineaGuinea-BissauGuyanaHondurasHong Kong SAR, ChinaHungaryIcelandIndiaIndonesiaIran, Islamic Rep.IrelandItalyJamaicaJapanJordanKazakhstanKenyaKiribatiKorea, Rep.KosovoKuwaitKyrgyz RepublicLao PDRLatviaLebanonLesothoLiberiaLibyaLiechtensteinLithuaniaLuxembourgMacao SAR, ChinaMacedonia, FYRMadagascarMalawiMalaysiaMaldivesMaliMaltaMarshall IslandsMauritaniaMauritiusMexicoMicronesia, Fed. Sts.MoldovaMongoliaMontenegroMoroccoMozambiqueNamibiaNepalNetherlandsNew ZealandNicaraguaNigeriaNorwayOmanPakistanPalauPanamaPapua New GuineaParaguayPeruPolandPortugalRomaniaRussian FederationRwandaSao Tome and PrincipeSenegalSerbiaSeychellesSierra LeoneSingaporeSlovak RepublicSloveniaSolomon IslandsSomaliaSouth AfricaSpainSri LankaSt. Kitts and NevisSt. LuciaSt. Vincent and the GrenadinesSudanSurinameSwazilandSwedenSwitzerlandSyrian Arab RepublicTajikistanTanzaniaThailandTimor-LesteTongaTrinidad and TobagoTunisiaTurkeyTurkmenistanTuvaluUgandaUkraineUnited KingdomUnited StatesUruguayUzbekistanVanuatuVenezuela, RBVietnamWest Bank and GazaYemen, Rep.ZambiaZimbabwe

línea de tiempo (timeline):

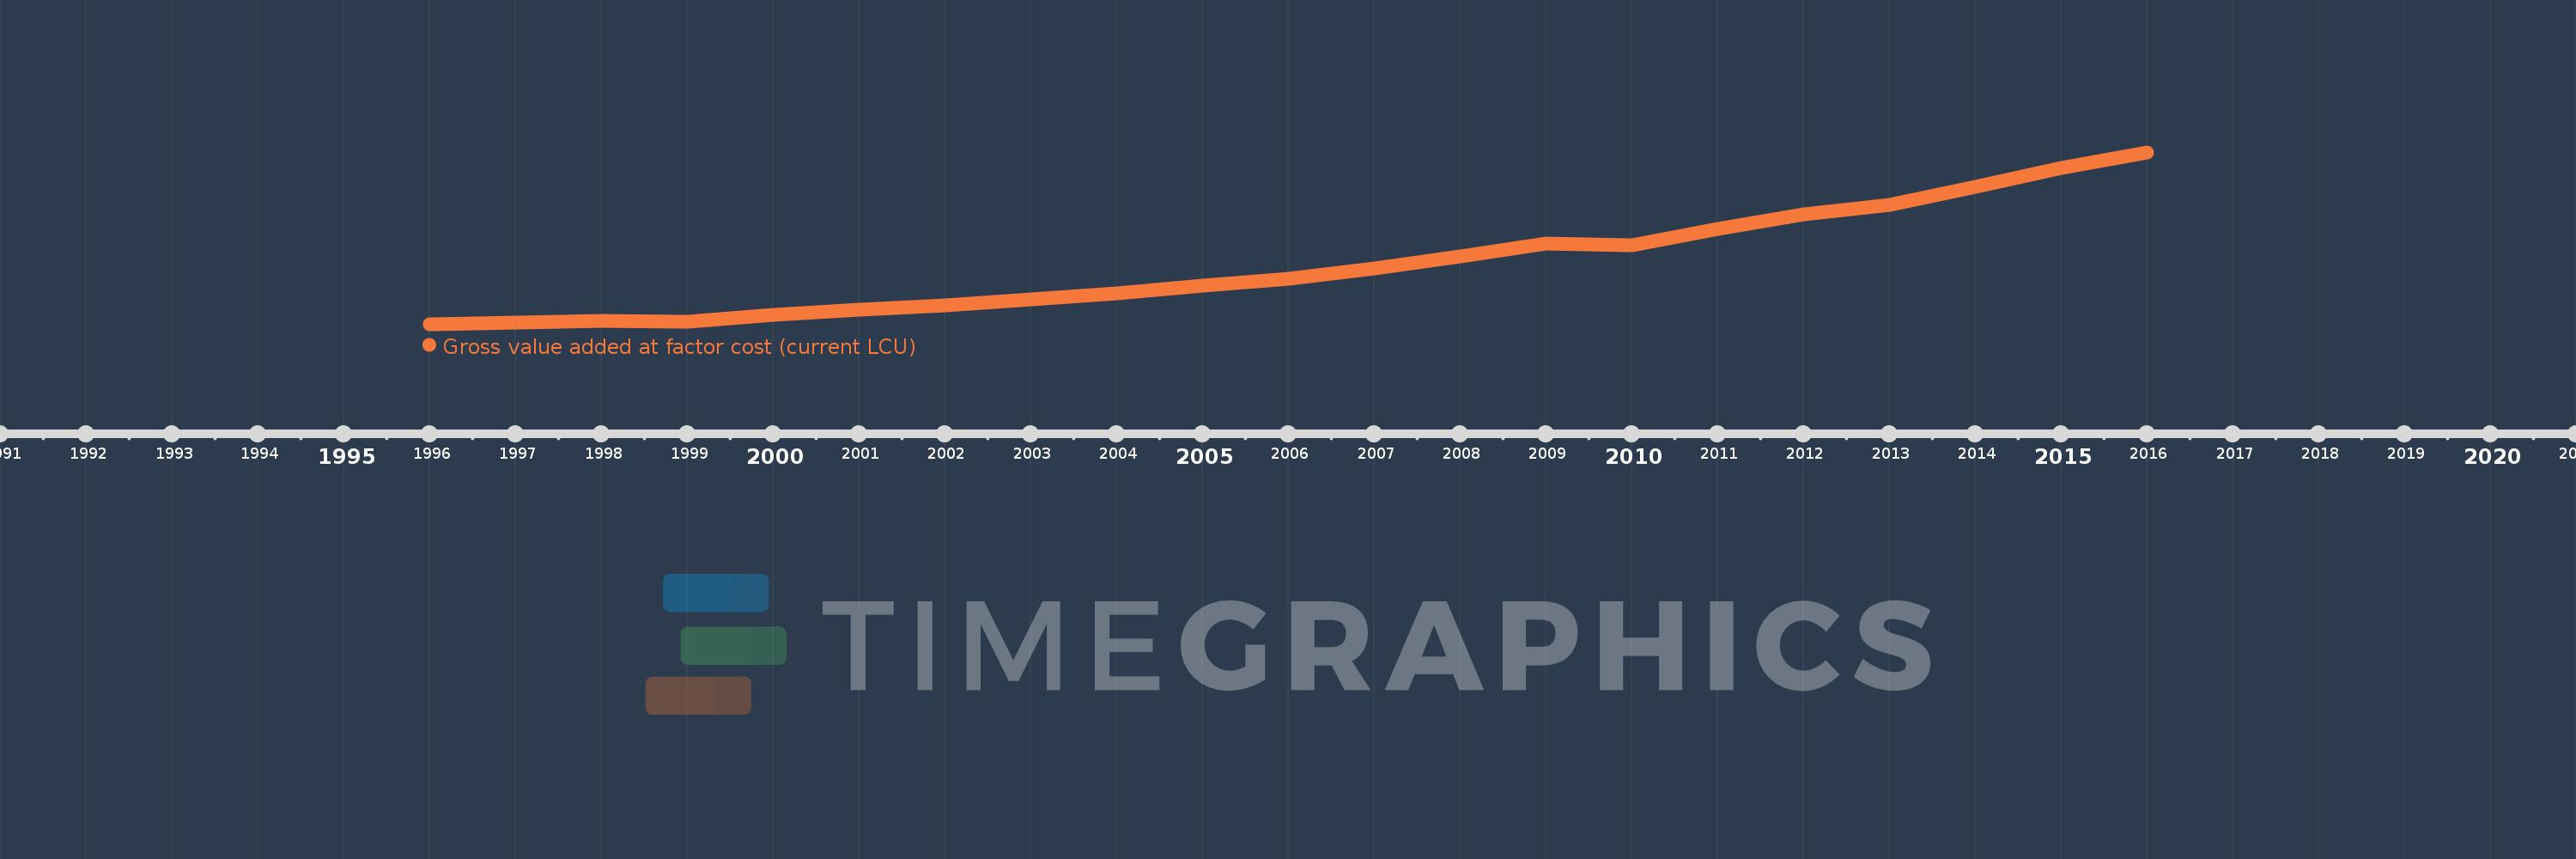
En esta escala de tiempo se presenta un gráfico de 1996 y 2016 de Moldova. Los datos de 1995 están ausentes. El número de observaciones reales por fecha: 21.

Fuente (nombre):

Indicadores del desarrollo mundial

Fuente (organización):

World Bank national accounts data, and OECD National Accounts data files.

Categorías:

Economy & Growth

Se ha actualizado:

23 abr 2017 año

Los indicadores de los cambios de valor en los últimos años

En promedio:
39.983 bn
Mínimo:
5.744 bn
1 ene 1996 año
Máximo:
103.461 bn
1 ene 2016 año
A la fecha de observación
Valor
Cambio absoluto
El cambio con respecto al valor anterior
1 ene 1996 año
5.744 bn
+5.744 bn
0.0%
1 ene 1997 año
6.826 bn
+1.082 bn
18.83%
1 ene 1998 año
7.665 bn
+838.8 millones
12.29%
1 ene 1999 año
7.401 bn
-264.0 millones
-3.44%
1 ene 2000 año
10.999 bn
+3.598 bn
48.62%
1 ene 2001 año
14.022 bn
+3.023 bn
27.49%
1 ene 2002 año
16.636 bn
+2.614 bn
18.64%
1 ene 2003 año
19.689 bn
+3.053 bn
18.35%
1 ene 2004 año
23.523 bn
+3.834 bn
19.47%
1 ene 2005 año
27.518 bn
+3.995 bn
16.98%
1 ene 2006 año
31.616 bn
+4.098 bn
14.89%
1 ene 2007 año
37.339 bn
+5.723 bn
18.1%
1 ene 2008 año
44.413 bn
+7.074 bn
18.95%
1 ene 2009 año
51.774 bn
+7.361 bn
16.57%
1 ene 2010 año
50.809 bn
-964.358 millones
-1.86%
1 ene 2011 año
59.921 bn
+9.111 bn
17.93%
1 ene 2012 año
68.39 bn
+8.469 bn
14.13%
1 ene 2013 año
73.686 bn
+5.296 bn
7.74%
1 ene 2014 año
83.719 bn
+10.033 bn
13.62%
1 ene 2015 año
94.504 bn
+10.785 bn
12.88%
1 ene 2016 año
103.461 bn
+8.957 bn
9.48%

Ranking de los países por los datos estadísticos actuales