33
/es/
AIzaSyAYiBZKx7MnpbEhh9jyipgxe19OcubqV5w
August 1, 2025
183005
Macao SAR, China
MAC
true
2
1
Gross value added at factor cost (current LCU)
2013,2012,2011,2010,2009,2008,2007,2006,2005,2004,2003,2002,2001,2000,1999,1998,1997,1996,1995,1994,1993,1992
Download
Estadísticas Globales de la Biblioteca →Macao SAR, China →

Gross value added at factor cost (current LCU)

Estas estadísticas en otros países:

AfghanistanAlbaniaAlgeriaAndorraAntigua and BarbudaArgentinaArmeniaArubaAustraliaAustriaAzerbaijanBahamas, TheBahrainBangladeshBarbadosBelarusBelgiumBelizeBeninBermudaBhutanBoliviaBosnia and HerzegovinaBotswanaBrazilBulgariaBurkina FasoBurundiCabo VerdeCambodiaCameroonCanadaCayman IslandsCentral African RepublicChadChileColombiaCongo, Dem. Rep.Costa RicaCroatiaCubaCyprusCzech RepublicDenmarkDjiboutiDominicaDominican RepublicEcuadorEgypt, Arab Rep.El SalvadorEquatorial GuineaEritreaEstoniaEthiopiaFaroe IslandsFijiFinlandFranceGabonGambia, TheGeorgiaGermanyGhanaGreeceGrenadaGuatemalaGuineaGuinea-BissauGuyanaHondurasHong Kong SAR, ChinaHungaryIcelandIndiaIndonesiaIran, Islamic Rep.IrelandItalyJamaicaJapanJordanKazakhstanKenyaKiribatiKorea, Rep.KosovoKuwaitKyrgyz RepublicLao PDRLatviaLebanonLesothoLiberiaLibyaLiechtensteinLithuaniaLuxembourgMacao SAR, ChinaMacedonia, FYRMadagascarMalawiMalaysiaMaldivesMaliMaltaMarshall IslandsMauritaniaMauritiusMexicoMicronesia, Fed. Sts.MoldovaMongoliaMontenegroMoroccoMozambiqueNamibiaNepalNetherlandsNew ZealandNicaraguaNigeriaNorwayOmanPakistanPalauPanamaPapua New GuineaParaguayPeruPolandPortugalRomaniaRussian FederationRwandaSao Tome and PrincipeSenegalSerbiaSeychellesSierra LeoneSingaporeSlovak RepublicSloveniaSolomon IslandsSomaliaSouth AfricaSpainSri LankaSt. Kitts and NevisSt. LuciaSt. Vincent and the GrenadinesSudanSurinameSwazilandSwedenSwitzerlandSyrian Arab RepublicTajikistanTanzaniaThailandTimor-LesteTongaTrinidad and TobagoTunisiaTurkeyTurkmenistanTuvaluUgandaUkraineUnited KingdomUnited StatesUruguayUzbekistanVanuatuVenezuela, RBVietnamWest Bank and GazaYemen, Rep.ZambiaZimbabwe

línea de tiempo (timeline):

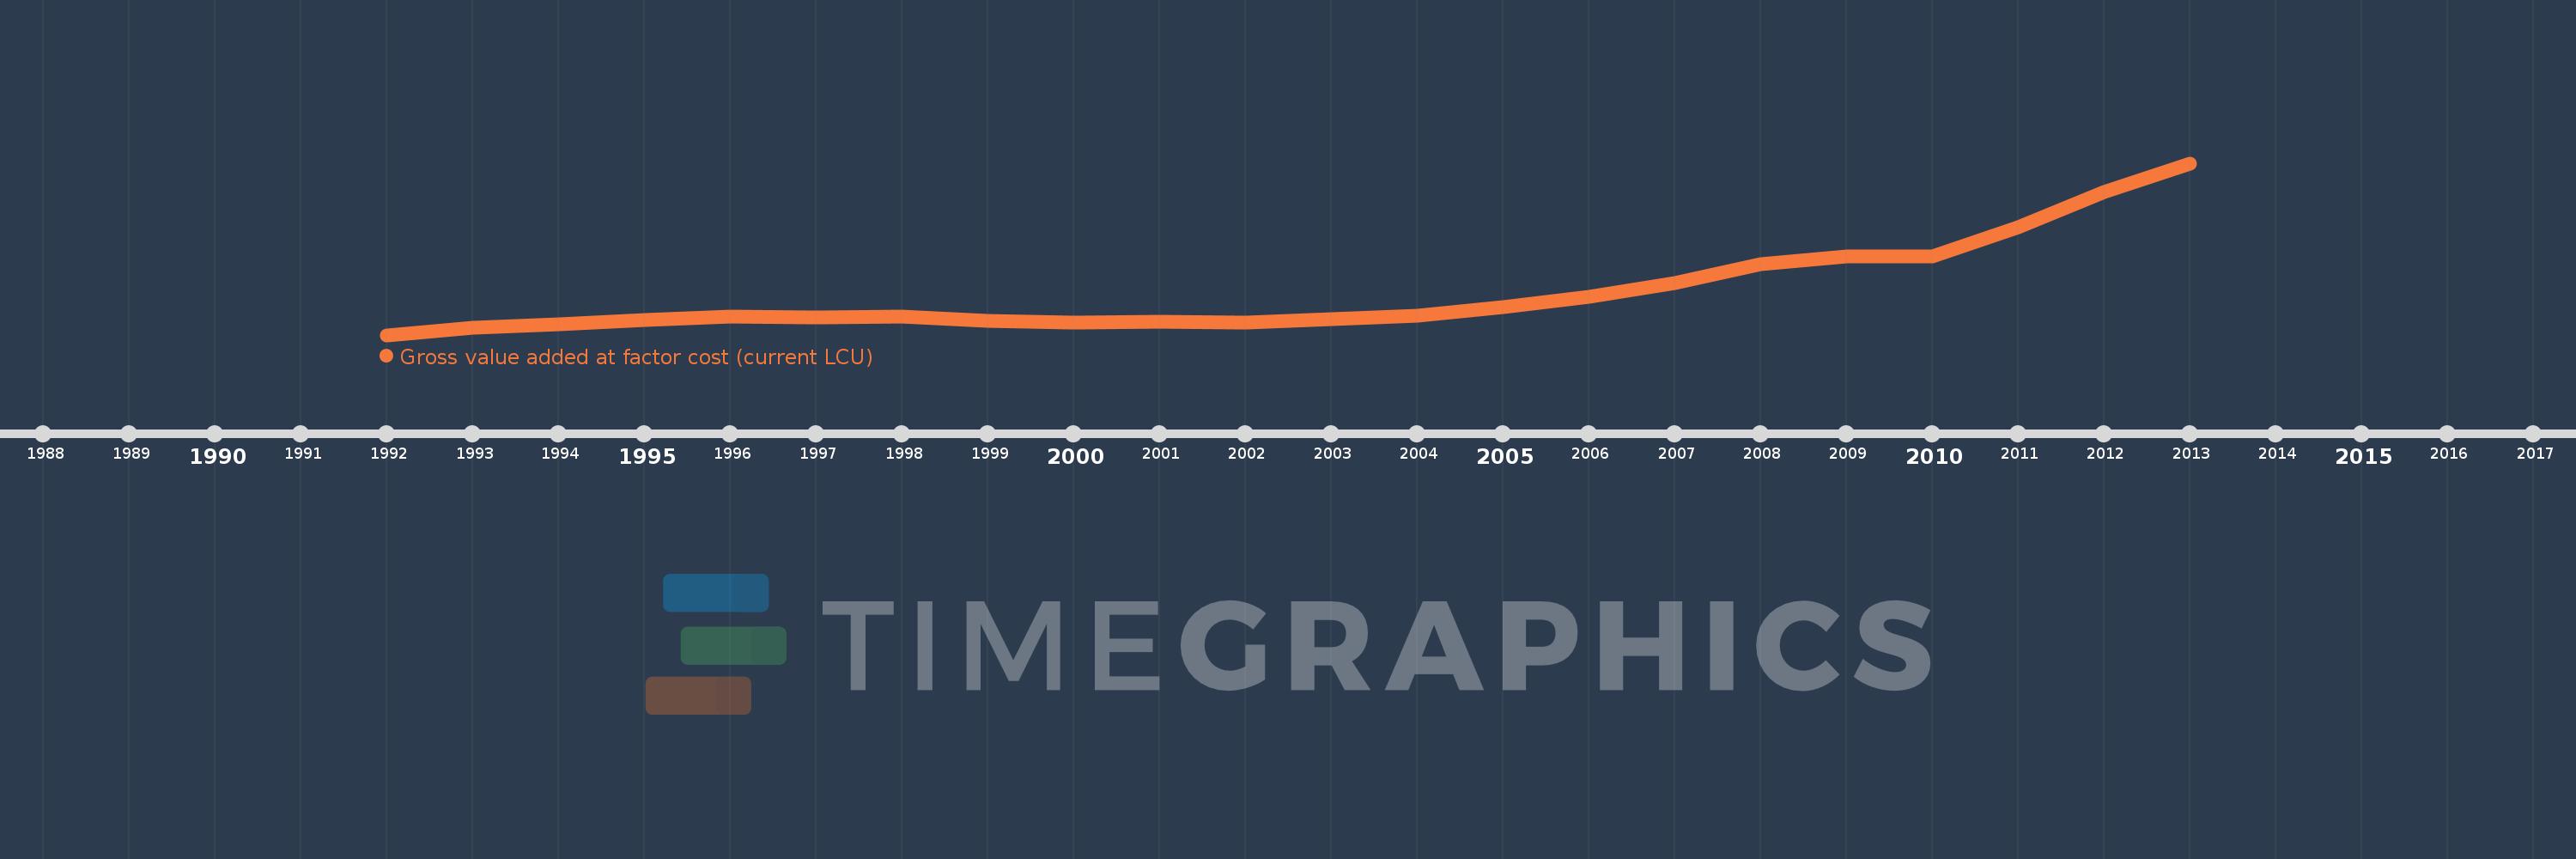
En esta escala de tiempo se presenta un gráfico de 1992 y 2013 de Macao SAR, China. Los datos de 1991 están ausentes. El número de observaciones reales por fecha: 22.

Fuente (nombre):

Indicadores del desarrollo mundial

Fuente (organización):

World Bank national accounts data, and OECD National Accounts data files.

Categorías:

Economy & Growth

Se ha actualizado:

23 abr 2017 año

Los indicadores de los cambios de valor en los últimos años

En promedio:
75.042 bn
Mínimo:
26.931 bn
1 ene 1992 año
Máximo:
219.647 bn
1 ene 2013 año
A la fecha de observación
Valor
Cambio absoluto
El cambio con respecto al valor anterior
1 ene 1992 año
26.931 bn
+26.931 bn
0.0%
1 ene 1993 año
34.689 bn
+7.758 bn
28.81%
1 ene 1994 año
39.297 bn
+4.608 bn
13.28%
1 ene 1995 año
43.351 bn
+4.054 bn
10.32%
1 ene 1996 año
48.039 bn
+4.688 bn
10.81%
1 ene 1997 año
46.698 bn
-1.341 bn
-2.79%
1 ene 1998 año
47.448 bn
+749.4 millones
1.6%
1 ene 1999 año
42.443 bn
-5.005 bn
-10.55%
1 ene 2000 año
40.623 bn
-1.82 bn
-4.29%
1 ene 2001 año
41.727 bn
+1.104 bn
2.72%
1 ene 2002 año
41.087 bn
-640.3 millones
-1.53%
1 ene 2003 año
44.352 bn
+3.265 bn
7.95%
1 ene 2004 año
48.629 bn
+4.277 bn
9.64%
1 ene 2005 año
58.622 bn
+9.993 bn
20.55%
1 ene 2006 año
69.886 bn
+11.264 bn
19.21%
1 ene 2007 año
84.77 bn
+14.884 bn
21.3%
1 ene 2008 año
106.54 bn
+21.77 bn
25.68%
1 ene 2009 año
115.018 bn
+8.478 bn
7.96%
1 ene 2010 año
115.378 bn
+360.4 millones
0.31%
1 ene 2011 año
147.934 bn
+32.556 bn
28.22%
1 ene 2012 año
187.808 bn
+39.874 bn
26.95%
1 ene 2013 año
219.647 bn
+31.839 bn
16.95%

Ranking de los países por los datos estadísticos actuales