33
/es/
AIzaSyAYiBZKx7MnpbEhh9jyipgxe19OcubqV5w
May 1, 2025
181178
Lithuania
LTU
true
2
1
Gross value added at factor cost (current LCU)
2016,2015,2014,2013,2012,2011,2010,2009,2008,2007,2006,2005,2004,2003,2002,2001,2000,1999,1998,1997,1996
Download
Estadísticas Globales de la Biblioteca →Lithuania →

Gross value added at factor cost (current LCU)

Estas estadísticas en otros países:

AfghanistanAlbaniaAlgeriaAndorraAntigua and BarbudaArgentinaArmeniaArubaAustraliaAustriaAzerbaijanBahamas, TheBahrainBangladeshBarbadosBelarusBelgiumBelizeBeninBermudaBhutanBoliviaBosnia and HerzegovinaBotswanaBrazilBulgariaBurkina FasoBurundiCabo VerdeCambodiaCameroonCanadaCayman IslandsCentral African RepublicChadChileColombiaCongo, Dem. Rep.Costa RicaCroatiaCubaCyprusCzech RepublicDenmarkDjiboutiDominicaDominican RepublicEcuadorEgypt, Arab Rep.El SalvadorEquatorial GuineaEritreaEstoniaEthiopiaFaroe IslandsFijiFinlandFranceGabonGambia, TheGeorgiaGermanyGhanaGreeceGrenadaGuatemalaGuineaGuinea-BissauGuyanaHondurasHong Kong SAR, ChinaHungaryIcelandIndiaIndonesiaIran, Islamic Rep.IrelandItalyJamaicaJapanJordanKazakhstanKenyaKiribatiKorea, Rep.KosovoKuwaitKyrgyz RepublicLao PDRLatviaLebanonLesothoLiberiaLibyaLiechtensteinLithuaniaLuxembourgMacao SAR, ChinaMacedonia, FYRMadagascarMalawiMalaysiaMaldivesMaliMaltaMarshall IslandsMauritaniaMauritiusMexicoMicronesia, Fed. Sts.MoldovaMongoliaMontenegroMoroccoMozambiqueNamibiaNepalNetherlandsNew ZealandNicaraguaNigeriaNorwayOmanPakistanPalauPanamaPapua New GuineaParaguayPeruPolandPortugalRomaniaRussian FederationRwandaSao Tome and PrincipeSenegalSerbiaSeychellesSierra LeoneSingaporeSlovak RepublicSloveniaSolomon IslandsSomaliaSouth AfricaSpainSri LankaSt. Kitts and NevisSt. LuciaSt. Vincent and the GrenadinesSudanSurinameSwazilandSwedenSwitzerlandSyrian Arab RepublicTajikistanTanzaniaThailandTimor-LesteTongaTrinidad and TobagoTunisiaTurkeyTurkmenistanTuvaluUgandaUkraineUnited KingdomUnited StatesUruguayUzbekistanVanuatuVenezuela, RBVietnamWest Bank and GazaYemen, Rep.ZambiaZimbabwe

línea de tiempo (timeline):

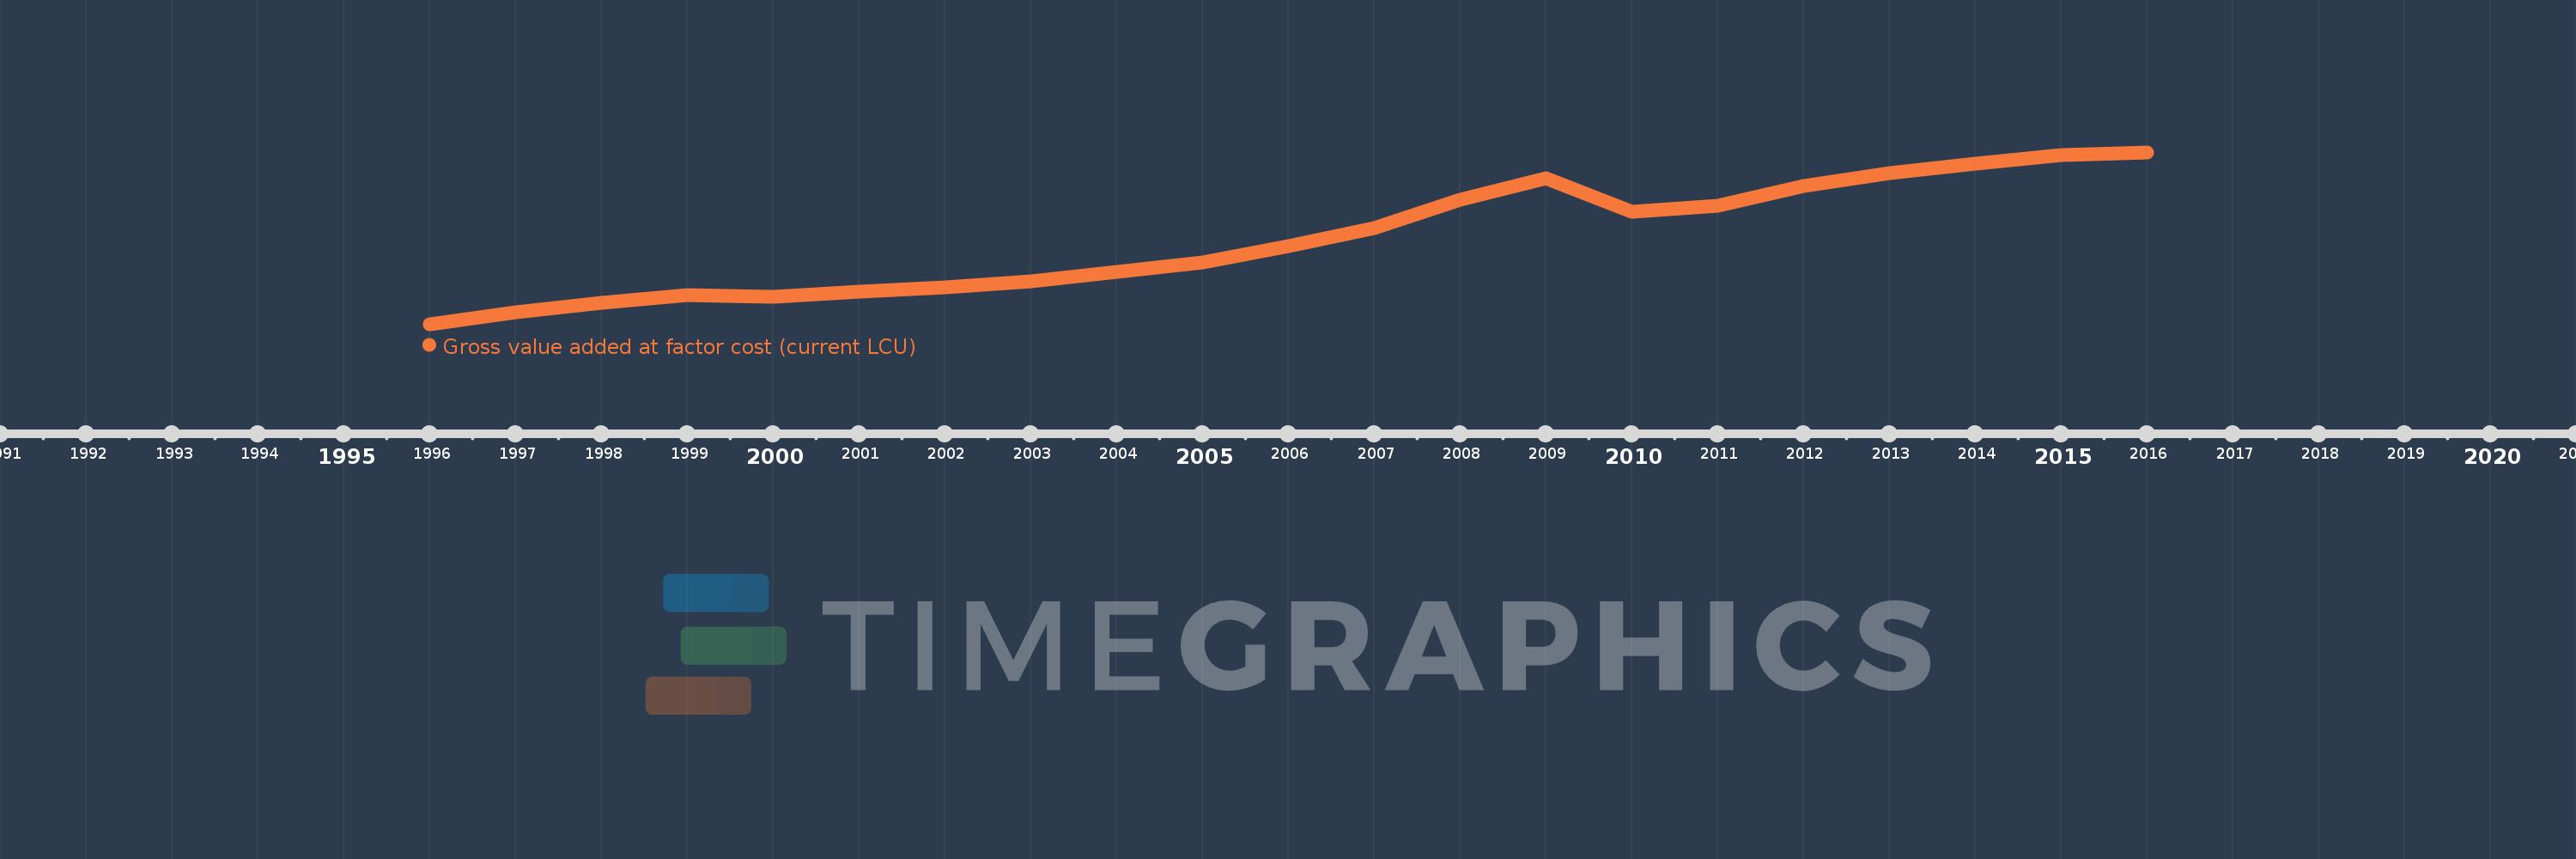
En esta escala de tiempo se presenta un gráfico de 1996 y 2016 de Lithuania. Los datos de 1995 están ausentes. El número de observaciones reales por fecha: 21.

Fuente (nombre):

Indicadores del desarrollo mundial

Fuente (organización):

World Bank national accounts data, and OECD National Accounts data files.

Categorías:

Economy & Growth

Se ha actualizado:

23 abr 2017 año

Los indicadores de los cambios de valor en los últimos años

En promedio:
19.996 bn
Mínimo:
6.936 bn
1 ene 1996 año
Máximo:
33.37 bn
1 ene 2016 año
A la fecha de observación
Valor
Cambio absoluto
El cambio con respecto al valor anterior
1 ene 1996 año
6.936 bn
+6.936 bn
0.0%
1 ene 1997 año
8.734 bn
+1.798 bn
25.92%
1 ene 1998 año
10.275 bn
+1.541 bn
17.65%
1 ene 1999 año
11.413 bn
+1.138 bn
11.08%
1 ene 2000 año
11.174 bn
-239.414 millones
-2.1%
1 ene 2001 año
11.881 bn
+707.173 millones
6.33%
1 ene 2002 año
12.635 bn
+753.625 millones
6.34%
1 ene 2003 año
13.524 bn
+889.409 millones
7.04%
1 ene 2004 año
14.937 bn
+1.413 bn
10.45%
1 ene 2005 año
16.5 bn
+1.563 bn
10.46%
1 ene 2006 año
19.01 bn
+2.51 bn
15.21%
1 ene 2007 año
21.734 bn
+2.724 bn
14.33%
1 ene 2008 año
26.076 bn
+4.343 bn
19.98%
1 ene 2009 año
29.349 bn
+3.273 bn
12.55%
1 ene 2010 año
24.3 bn
-5.049 bn
-17.2%
1 ene 2011 año
25.21 bn
+909.391 millones
3.74%
1 ene 2012 año
28.148 bn
+2.938 bn
11.65%
1 ene 2013 año
30.151 bn
+2.004 bn
7.12%
1 ene 2014 año
31.654 bn
+1.502 bn
4.98%
1 ene 2015 año
32.912 bn
+1.258 bn
3.97%
1 ene 2016 año
33.37 bn
+457.857 millones
1.39%

Ranking de los países por los datos estadísticos actuales