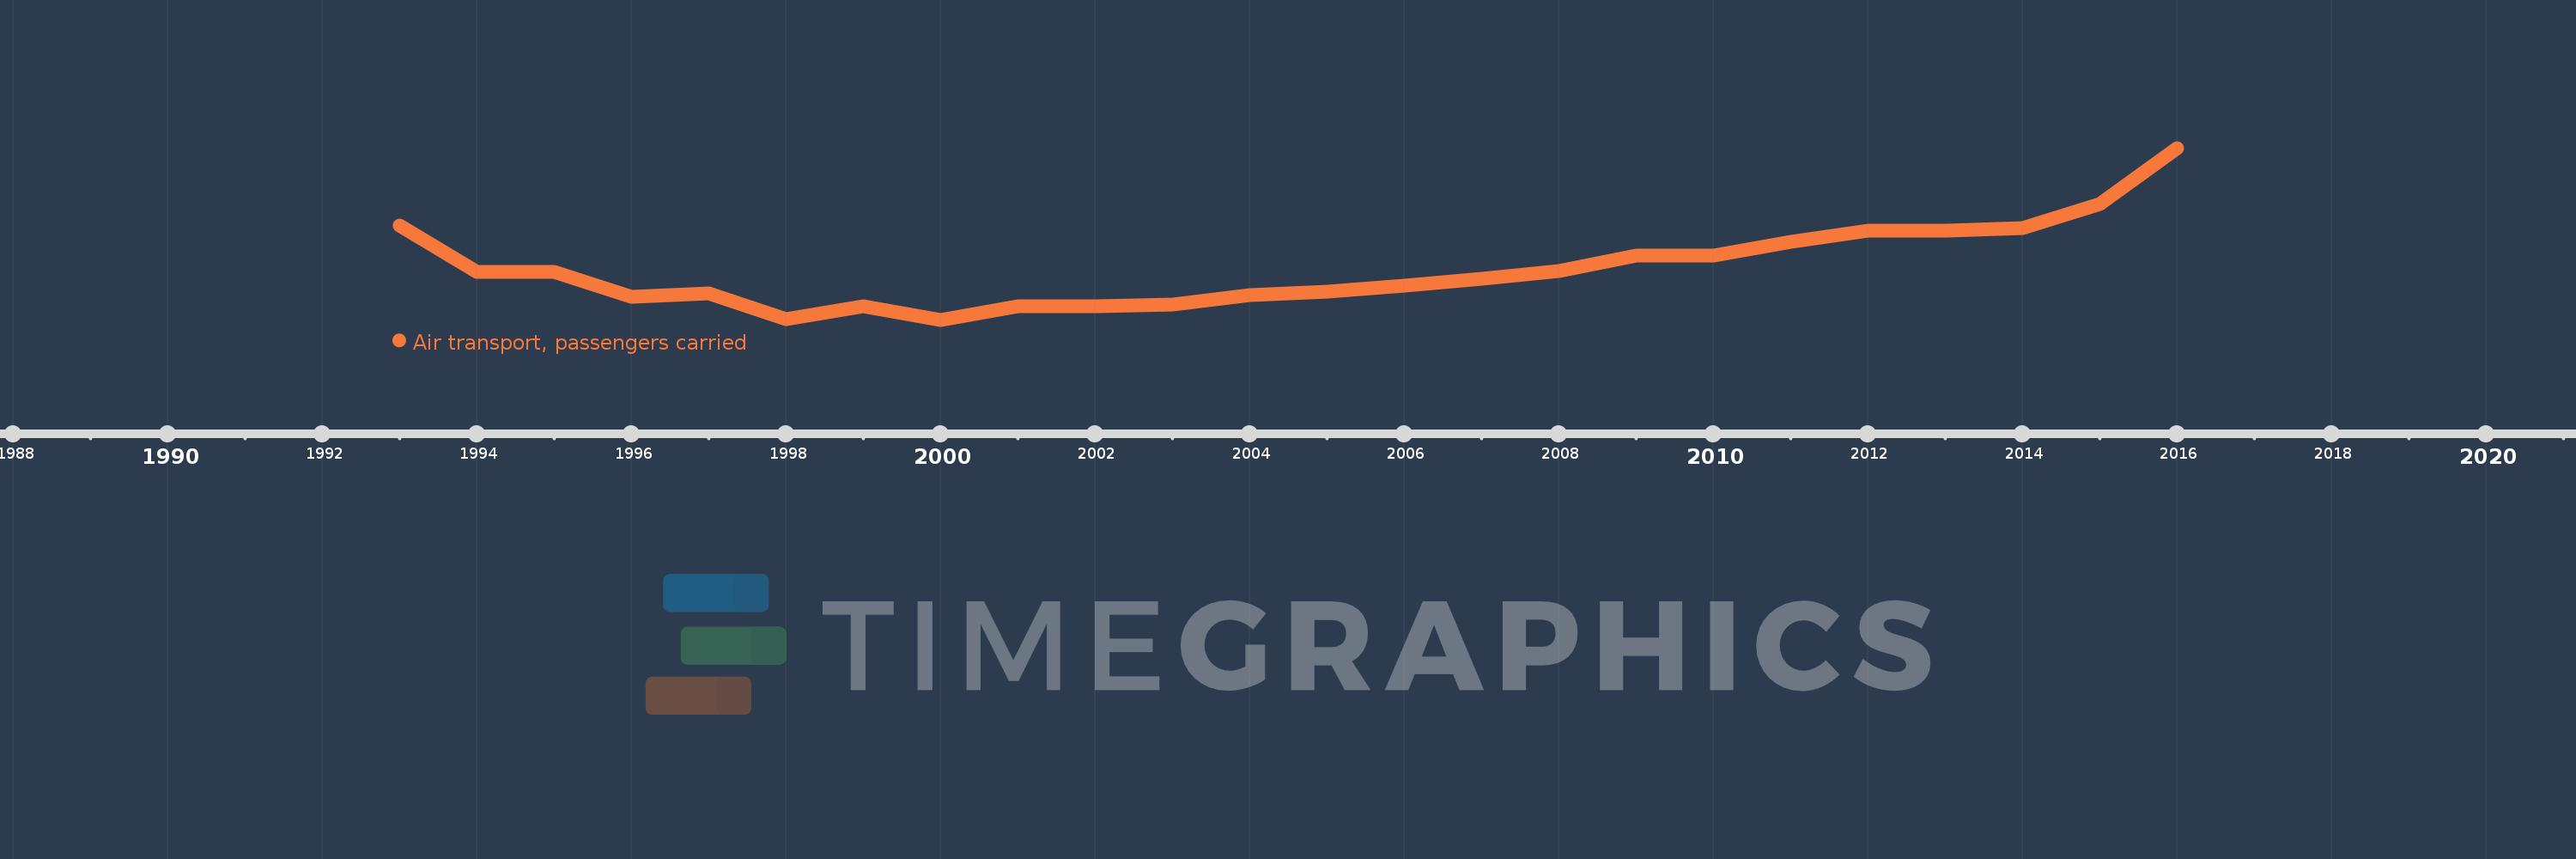
En esta escala de tiempo se presenta un gráfico de 1993 y 2016 de Moldova. Los datos de 1992 están ausentes. El número de observaciones reales por fecha: 24.
Fuente (nombre):
Indicadores del desarrollo mundial
Fuente (organización):
International Civil Aviation Organization, Civil Aviation Statistics of the World and ICAO staff estimates.
Categorías:
Infrastructure
Se ha actualizado:
23 abr 2017 año
Los indicadores de los cambios de valor en los últimos años
En promedio:
331.384 mil
Mínimo:
43.0 mil
1 ene 2000 año
Máximo:
1.006 millones
1 ene 2016 año
A la fecha de observación
Valor
Cambio absoluto
El cambio con respecto al valor anterior
1 ene 1993 año
571.1 mil
+571.1 mil
0.0%
1 ene 1994 año
312.3 mil
-258.8 mil
-45.32%
1 ene 1995 año
312.3 mil
0.0
0.0%
1 ene 1996 año
169.5 mil
-142.8 mil
-45.73%
1 ene 1997 año
190.0 mil
+20.5 mil
12.09%
1 ene 1998 año
46.4 mil
-143.6 mil
-75.58%
1 ene 1999 año
118.0 mil
+71.6 mil
154.31%
1 ene 2000 año
43.0 mil
-75.0 mil
-63.56%
1 ene 2001 año
117.532 mil
+74.532 mil
173.33%
1 ene 2002 año
120.125 mil
+2.593 mil
2.21%
1 ene 2003 año
129.377 mil
+9.252 mil
7.7%
1 ene 2004 año
179.084 mil
+49.707 mil
38.42%
1 ene 2005 año
200.615 mil
+21.531 mil
12.02%
1 ene 2006 año
231.985 mil
+31.37 mil
15.64%
1 ene 2007 año
273.81 mil
+41.825 mil
18.03%
1 ene 2008 año
314.361 mil
+40.551 mil
14.81%
1 ene 2009 año
401.199 mil
+86.838 mil
27.62%
1 ene 2010 año
402.423 mil
+1.224 mil
0.31%
1 ene 2011 año
479.457 mil
+77.034 mil
19.14%
1 ene 2012 año
540.679 mil
+61.222 mil
12.77%
1 ene 2013 año
543.872 mil
+3.193 mil
0.59%
1 ene 2014 año
557.653 mil
+13.781 mil
2.53%
1 ene 2015 año
692.496 mil
+134.843 mil
24.18%
1 ene 2016 año
1.006 millones
+313.446 mil
45.26%
Ranking de los países por los datos estadísticos actuales