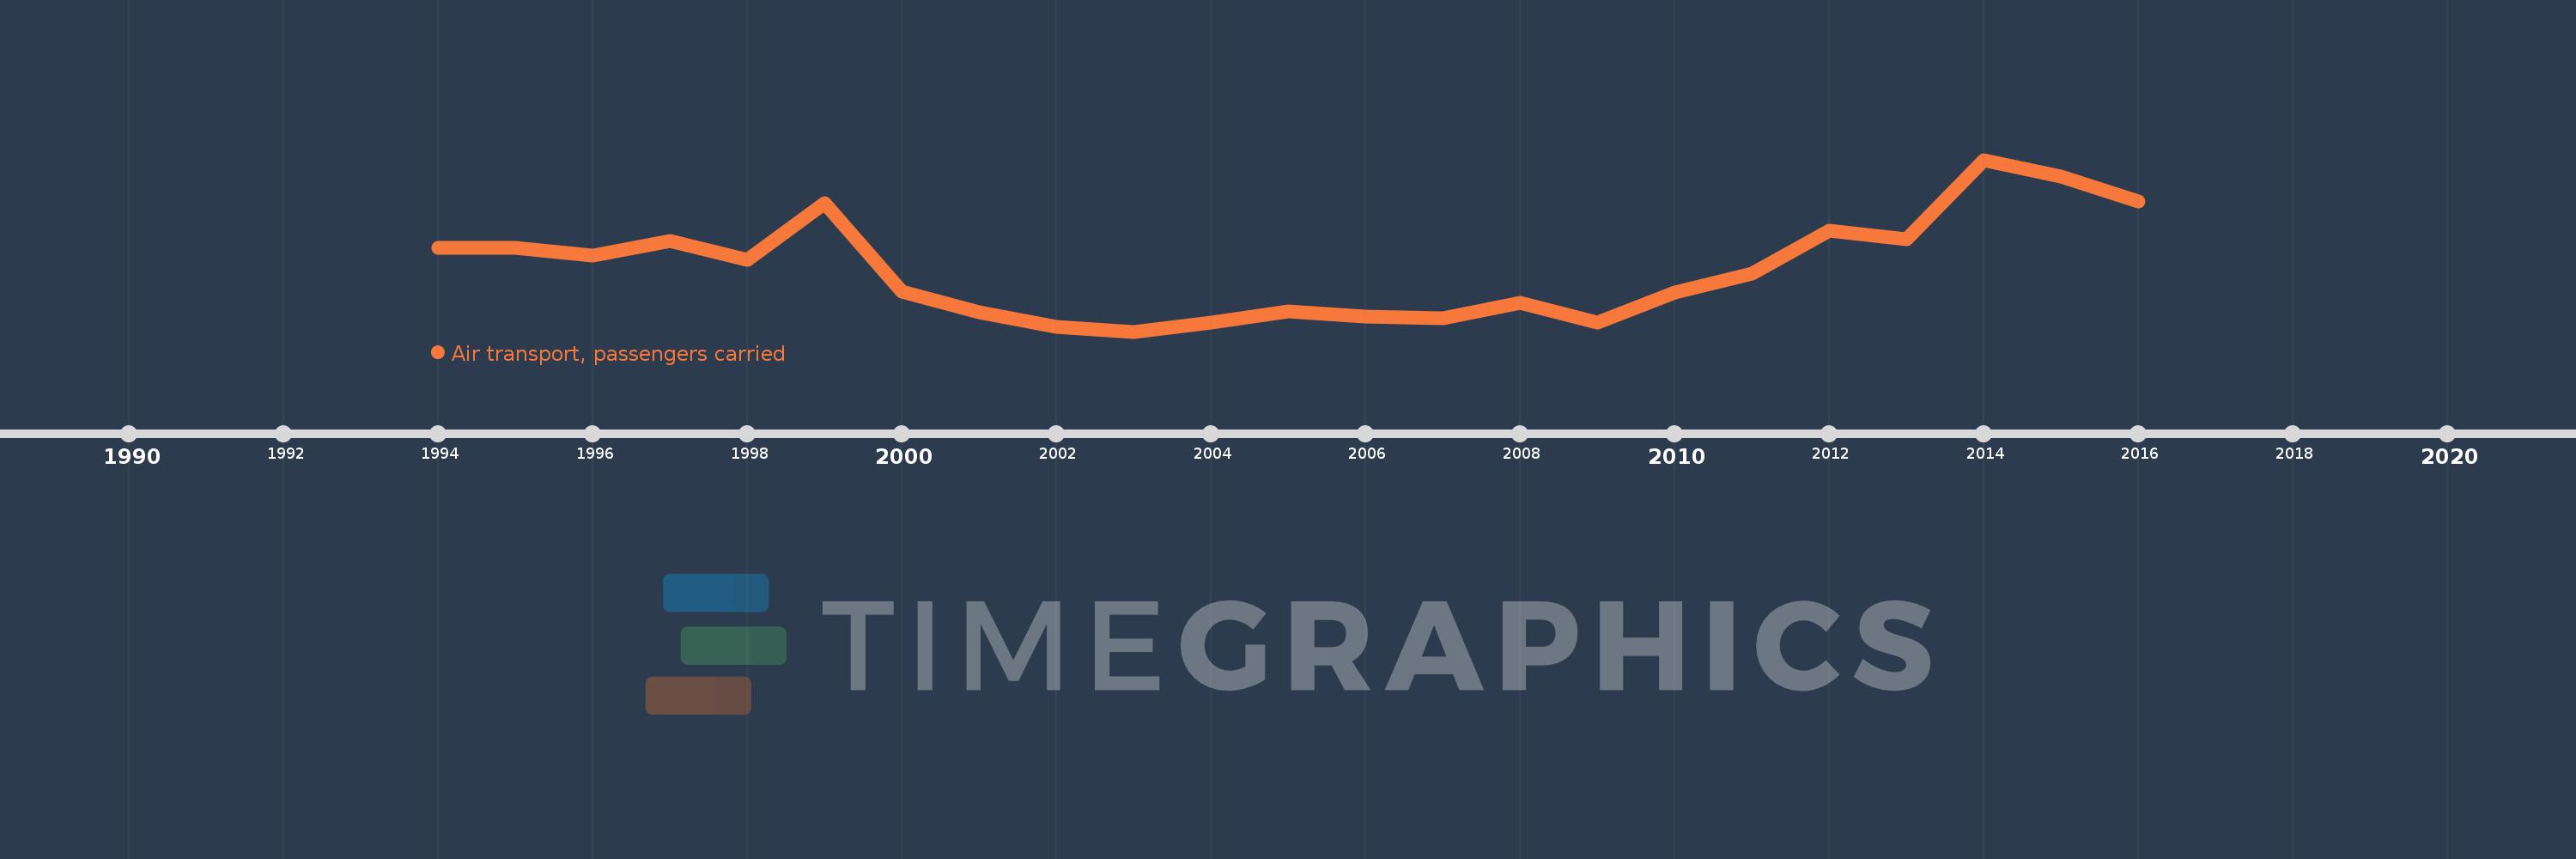
En esta escala de tiempo se presenta un gráfico de 1994 y 2016 de Kyrgyz Republic. Los datos de 1993 están ausentes. El número de observaciones reales por fecha: 23.
Fuente (nombre):
Indicadores del desarrollo mundial
Fuente (organización):
International Civil Aviation Organization, Civil Aviation Statistics of the World and ICAO staff estimates.
Categorías:
Infrastructure
Se ha actualizado:
23 abr 2017 año
Los indicadores de los cambios de valor en los últimos años
En promedio:
391.654 mil
Mínimo:
174.369 mil
1 ene 2003 año
Máximo:
771.165 mil
1 ene 2014 año
A la fecha de observación
Valor
Cambio absoluto
El cambio con respecto al valor anterior
1 ene 1994 año
464.0 mil
+464.0 mil
0.0%
1 ene 1995 año
464.0 mil
0.0
0.0%
1 ene 1996 año
438.7 mil
-25.3 mil
-5.45%
1 ene 1997 año
488.2 mil
+49.5 mil
11.28%
1 ene 1998 año
423.0 mil
-65.2 mil
-13.36%
1 ene 1999 año
620.1 mil
+197.1 mil
46.6%
1 ene 2000 año
312.1 mil
-308.0 mil
-49.67%
1 ene 2001 año
240.954 mil
-71.146 mil
-22.8%
1 ene 2002 año
192.06 mil
-48.894 mil
-20.29%
1 ene 2003 año
174.369 mil
-17.691 mil
-9.21%
1 ene 2004 año
205.604 mil
+31.235 mil
17.91%
1 ene 2005 año
245.57 mil
+39.966 mil
19.44%
1 ene 2006 año
225.923 mil
-19.647 mil
-8.0%
1 ene 2007 año
219.464 mil
-6.459 mil
-2.86%
1 ene 2008 año
274.981 mil
+55.517 mil
25.3%
1 ene 2009 año
204.525 mil
-70.456 mil
-25.62%
1 ene 2010 año
309.488 mil
+104.963 mil
51.32%
1 ene 2011 año
375.602 mil
+66.114 mil
21.36%
1 ene 2012 año
526.018 mil
+150.416 mil
40.05%
1 ene 2013 año
494.64 mil
-31.378 mil
-5.97%
1 ene 2014 año
771.165 mil
+276.525 mil
55.9%
1 ene 2015 año
712.284 mil
-58.881 mil
-7.64%
1 ene 2016 año
625.294 mil
-86.99 mil
-12.21%
Ranking de los países por los datos estadísticos actuales