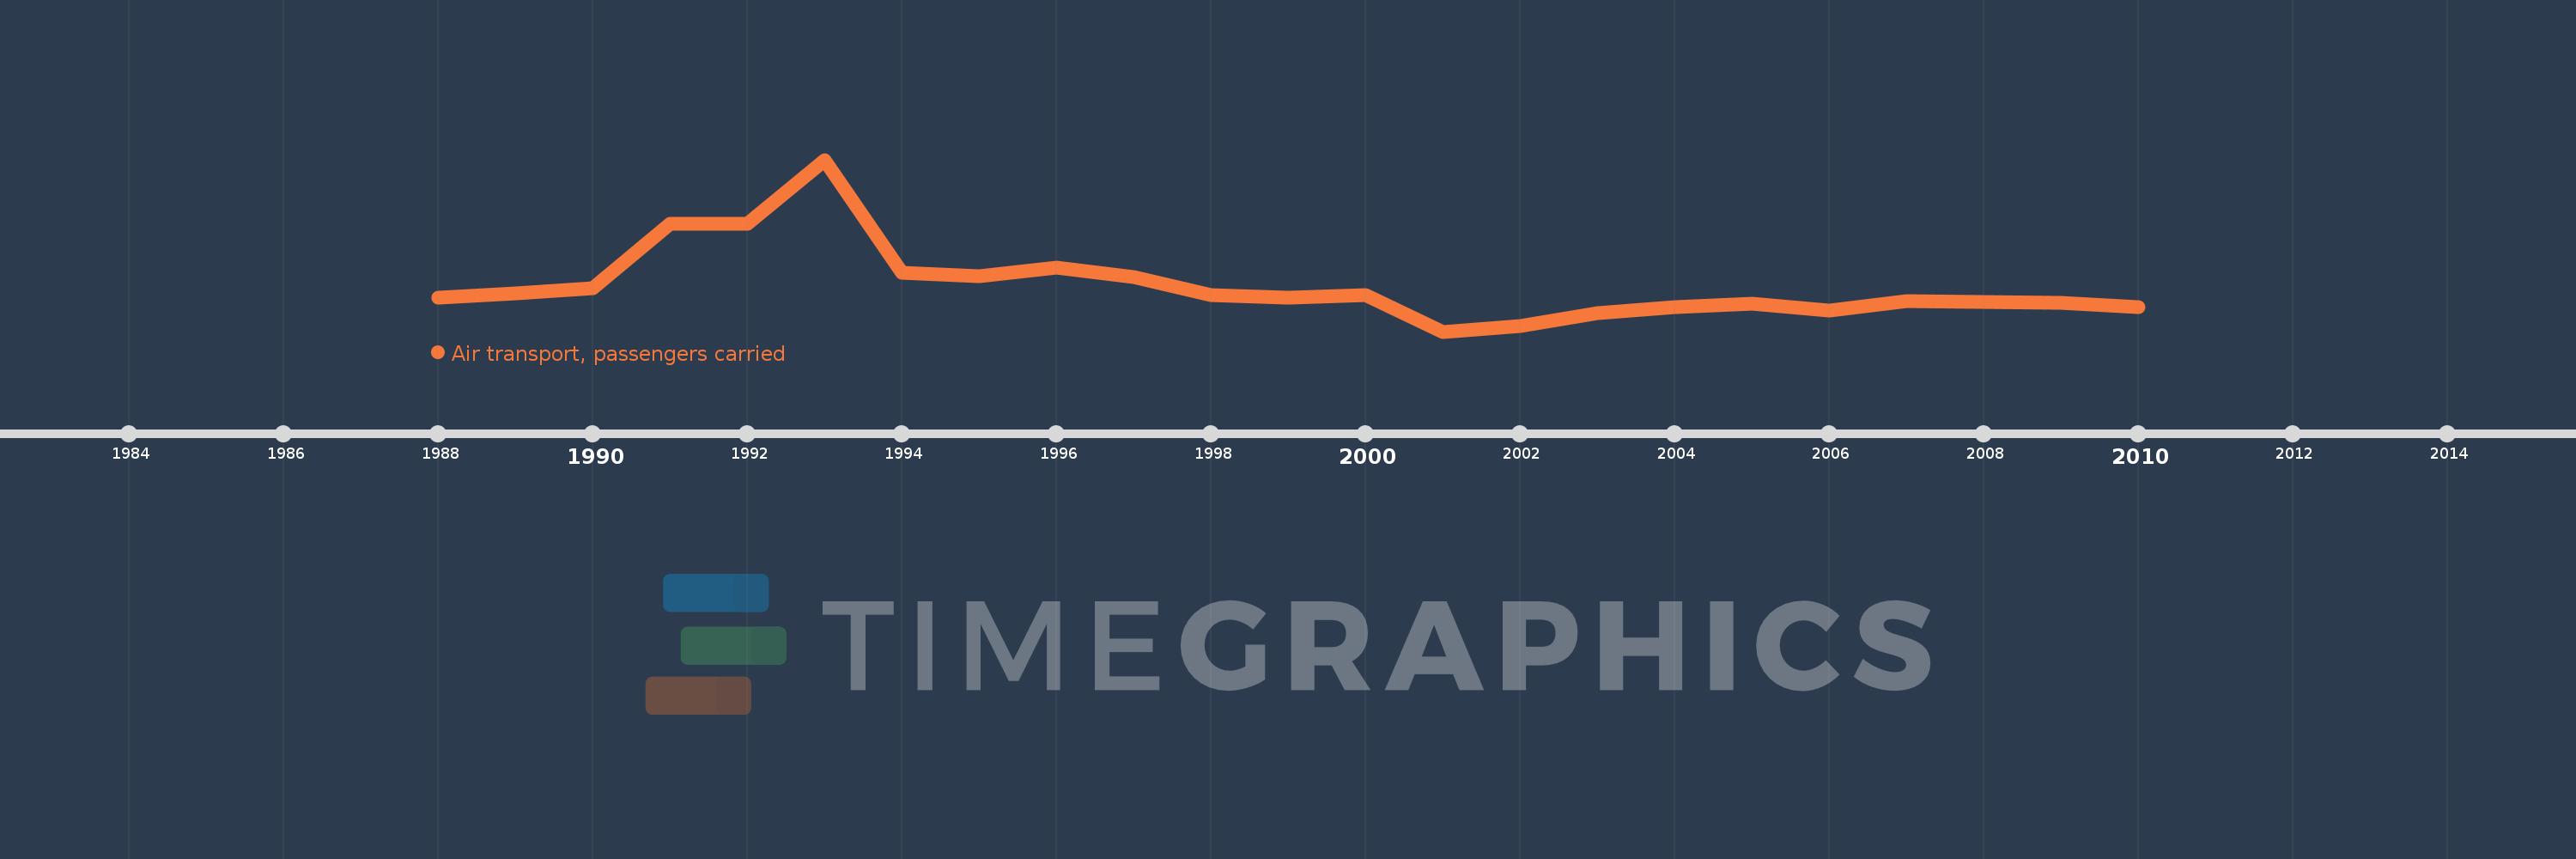
En esta escala de tiempo se presenta un gráfico de 1988 y 2010 de Marshall Islands. Los datos de 1987 están ausentes. El número de observaciones reales por fecha: 23.
Fuente (nombre):
Indicadores del desarrollo mundial
Fuente (organización):
International Civil Aviation Organization, Civil Aviation Statistics of the World and ICAO staff estimates.
Categorías:
Infrastructure
Se ha actualizado:
23 abr 2017 año
Los indicadores de los cambios de valor en los últimos años
En promedio:
37.42 mil
Mínimo:
16.109 mil
1 ene 2001 año
Máximo:
96.0 mil
1 ene 1993 año
A la fecha de observación
Valor
Cambio absoluto
El cambio con respecto al valor anterior
1 ene 1988 año
32.0 mil
+32.0 mil
0.0%
1 ene 1989 año
33.8 mil
+1.8 mil
5.62%
1 ene 1990 año
36.3 mil
+2.5 mil
7.4%
1 ene 1991 año
66.4 mil
+30.1 mil
82.92%
1 ene 1992 año
66.3 mil
-100.0
-0.15%
1 ene 1993 año
96.0 mil
+29.7 mil
44.8%
1 ene 1994 año
43.5 mil
-52.5 mil
-54.69%
1 ene 1995 año
41.9 mil
-1.6 mil
-3.68%
1 ene 1996 año
45.8 mil
+3.9 mil
9.31%
1 ene 1997 año
41.3 mil
-4.5 mil
-9.83%
1 ene 1998 año
33.1 mil
-8.2 mil
-19.85%
1 ene 1999 año
32.0 mil
-1.1 mil
-3.32%
1 ene 2000 año
33.1 mil
+1.1 mil
3.44%
1 ene 2001 año
16.109 mil
-16.991 mil
-51.33%
1 ene 2002 año
18.805 mil
+2.696 mil
16.74%
1 ene 2003 año
24.592 mil
+5.787 mil
30.77%
1 ene 2004 año
27.471 mil
+2.879 mil
11.71%
1 ene 2005 año
28.97 mil
+1.499 mil
5.46%
1 ene 2006 año
25.789 mil
-3.181 mil
-10.98%
1 ene 2007 año
30.232 mil
+4.443 mil
17.23%
1 ene 2008 año
29.98 mil
-252.0
-0.83%
1 ene 2009 año
29.53 mil
-450.0
-1.5%
1 ene 2010 año
27.692 mil
-1.838 mil
-6.22%
Ranking de los países por los datos estadísticos actuales