29
/es/
es
AIzaSyAYiBZKx7MnpbEhh9jyipgxe19OcubqV5w
April 1, 2024
189730
Maldives
MDV
true
2
1
Trained teachers in preprimary education, female (% of female teachers)
2015,2014,2013,2012,2011,2010,2007,2006,2004,2003,2002,2001,2000,1999
Download
Estadísticas Globales de la Biblioteca →Maldives →

Trained teachers in preprimary education, female (% of female teachers)

Estas estadísticas en otros países:
AndorraAngolaAntigua and BarbudaArab WorldArmeniaArubaAzerbaijanBahamas, TheBahrainBarbadosBelarusBelizeBeninBermudaBhutanBoliviaBotswanaBritish Virgin IslandsBrunei DarussalamBurkina FasoBurundiCabo VerdeCambodiaCameroonCaribbean small statesCayman IslandsChadColombiaCongo, Dem. Rep.Congo, Rep.Costa RicaCote d'IvoireCroatiaCubaDjiboutiDominicaDominican RepublicEcuadorEgypt, Arab Rep.El SalvadorEritreaEthiopiaFragile and conflict affected situationsGambia, TheGeorgiaGhanaGibraltarGrenadaGuineaGuinea-BissauGuyanaHeavily indebted poor countries (HIPC)HondurasIDA blendIDA onlyIDA totalIraqKazakhstanKenyaKuwaitKyrgyz RepublicLao PDRLeast developed countries: UN classificationLebanonLiberiaLow incomeMacao SAR, ChinaMadagascarMalaysiaMaldivesMaliMarshall IslandsMauritaniaMauritiusMiddle East & North AfricaMiddle East & North Africa (excluding high income)Middle East & North Africa (IDA & IBRD countries)MoldovaMongoliaMoroccoMyanmarNamibiaNauruNepalNicaraguaNigerOmanOther small statesPacific island small statesPanamaParaguayPre-demographic dividendQatarRwandaSamoaSao Tome and PrincipeSaudi ArabiaSenegalSerbiaSeychellesSierra LeoneSmall statesSolomon IslandsSouth AfricaSouth SudanSt. Kitts and NevisSt. LuciaSt. Vincent and the GrenadinesSub-Saharan Africa Sub-Saharan Africa (excluding high income)Sub-Saharan Africa (IDA & IBRD countries)SurinameSwazilandSyrian Arab RepublicTajikistanTanzaniaTogoTongaTrinidad and TobagoTuvaluUnited Arab EmiratesUzbekistanVietnamWest Bank and GazaZimbabwe
línea de tiempo (timeline):
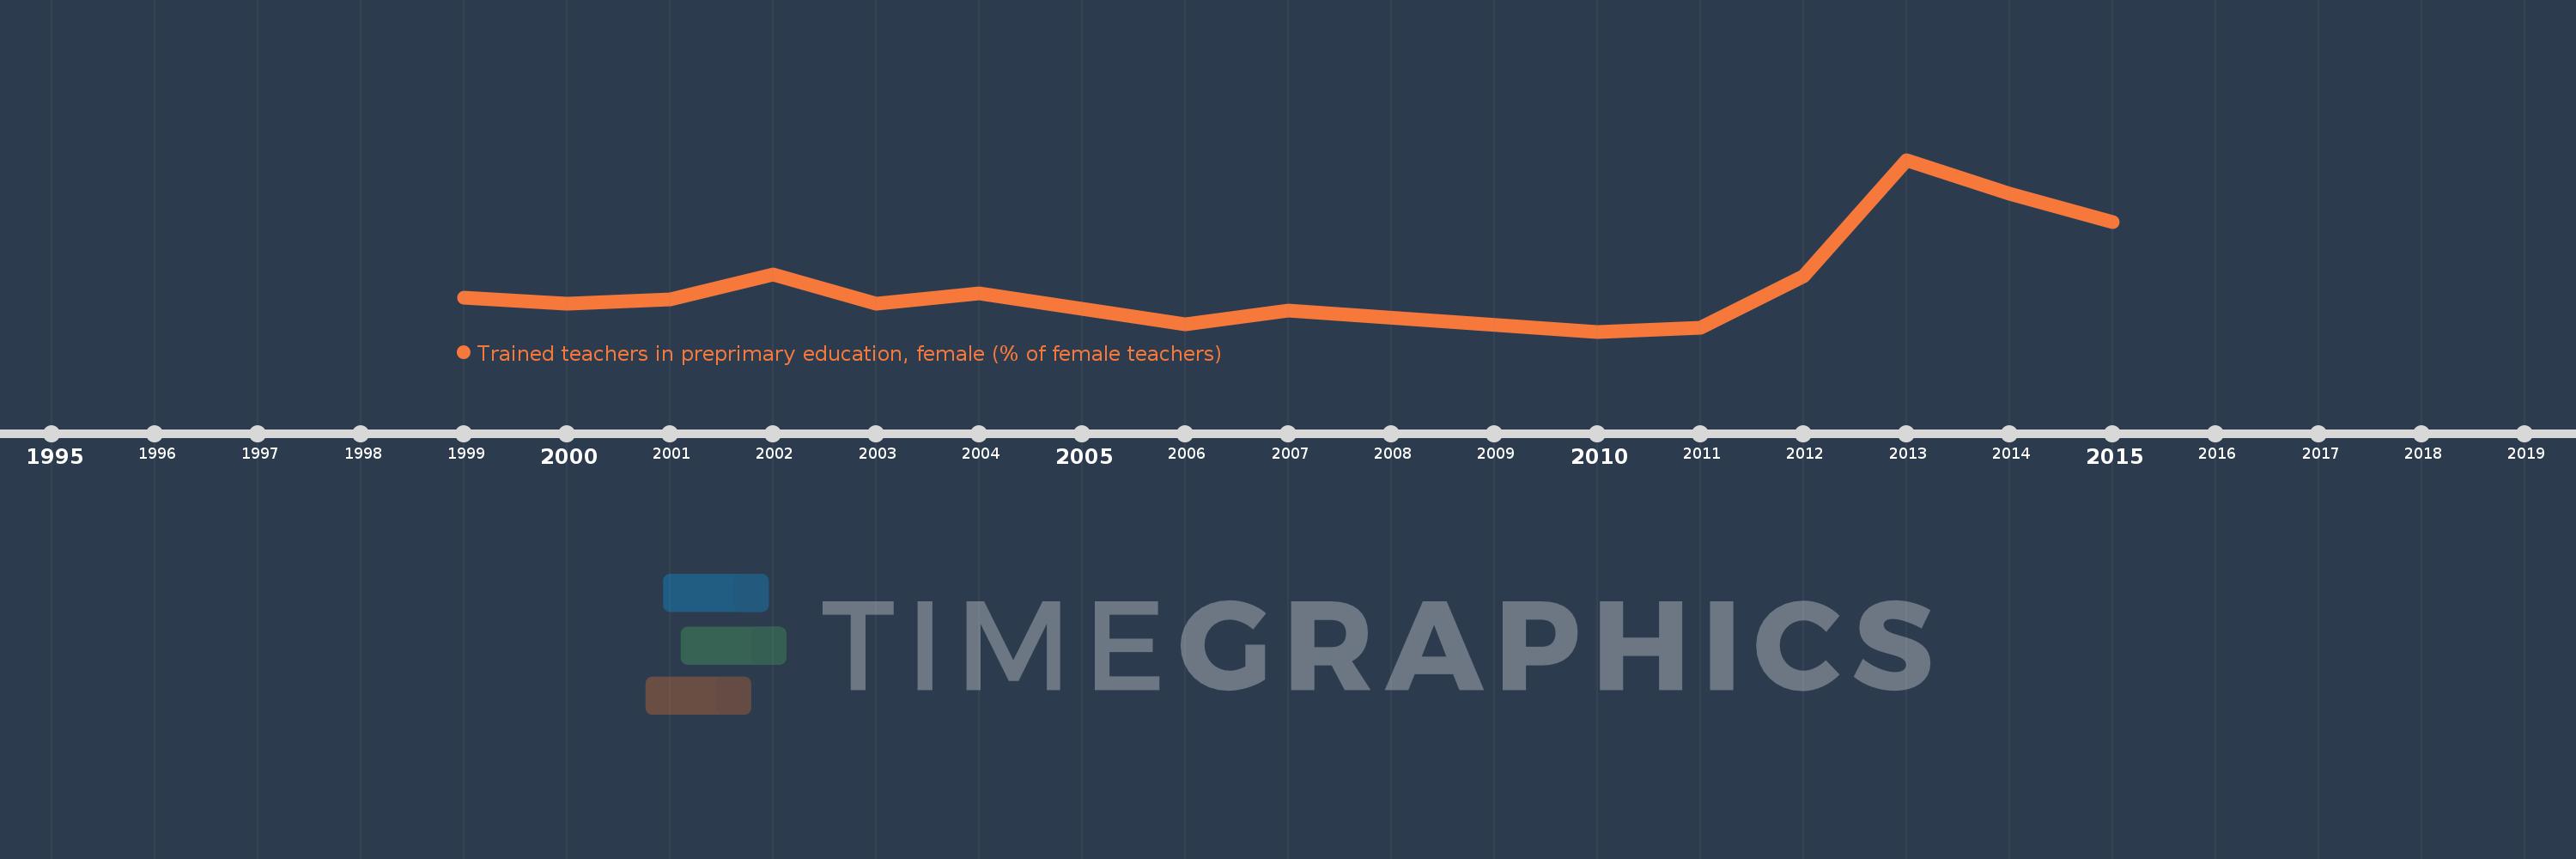
En esta escala de tiempo se presenta un gráfico de 1999 y 2015 de Maldives. Los datos de 1998 están ausentes. El número de observaciones reales por fecha: 14.
Fuente (nombre):
Indicadores del desarrollo mundial
Fuente (organización):
United Nations Educational, Scientific, and Cultural Organization (UNESCO) Institute for Statistics.
Categorías:
Education
Se ha actualizado:
23 abr 2017 año
Los indicadores de los cambios de valor en los últimos años
En promedio:
54.827
Mínimo:
38.396
1 ene 2010 año
Máximo:
92.927
1 ene 2013 año
A la fecha de observación
Valor
Cambio absoluto
El cambio con respecto al valor anterior
1 ene 1999 año
49.221
+49.221
0.0%
1 ene 2000 año
47.159
-2.062
-4.19%
1 ene 2001 año
48.705
+1.546
3.28%
1 ene 2002 año
56.654
+7.949
16.32%
1 ene 2003 año
47.217
-9.437
-16.66%
1 ene 2004 año
50.524
+3.307
7.0%
1 ene 2006 año
40.816
-9.708
-19.21%
1 ene 2007 año
44.983
+4.167
10.21%
1 ene 2010 año
38.396
-6.587
-14.64%
1 ene 2011 año
39.579
+1.183
3.08%
1 ene 2012 año
55.892
+16.313
41.22%
1 ene 2013 año
92.927
+37.035
66.26%
1 ene 2014 año
82.26
-10.667
-11.48%
1 ene 2015 año
73.251
-9.009
-10.95%
Ranking de los países por los datos estadísticos actuales

Comentarios:

Enviar
PremiumAbout & FeedbackAcuerdoPrivacidad
logo
© 2022 Selected Technologies LLC – Morgan Hill, California