29
/es/
es
AIzaSyAYiBZKx7MnpbEhh9jyipgxe19OcubqV5w
April 1, 2024
148691
Guyana
GUY
true
2
1
Trained teachers in preprimary education (% of total teachers)
2013,2012,2011,2010,2009,2008,2006,2004,2002,2001,2000
Download
Estadísticas Globales de la Biblioteca →Guyana →

Trained teachers in preprimary education (% of total teachers)

Estas estadísticas en otros países:
AndorraAngolaAntigua and BarbudaArab WorldArmeniaArubaAzerbaijanBahamas, TheBahrainBarbadosBelarusBelizeBeninBermudaBhutanBoliviaBotswanaBritish Virgin IslandsBrunei DarussalamBurkina FasoBurundiCabo VerdeCambodiaCameroonCaribbean small statesCayman IslandsChadColombiaCongo, Dem. Rep.Congo, Rep.Costa RicaCote d'IvoireCroatiaCubaDjiboutiDominicaDominican RepublicEcuadorEgypt, Arab Rep.El SalvadorEritreaEthiopiaFragile and conflict affected situationsGambia, TheGeorgiaGhanaGibraltarGrenadaGuineaGuinea-BissauGuyanaHeavily indebted poor countries (HIPC)HondurasIDA blendIDA onlyIDA totalIran, Islamic Rep.IraqKazakhstanKenyaKuwaitKyrgyz RepublicLao PDRLatin America & Caribbean Latin America & Caribbean (excluding high income)Latin America & the Caribbean (IDA & IBRD countries)Least developed countries: UN classificationLebanonLiberiaLow incomeMacao SAR, ChinaMadagascarMalaysiaMaldivesMaliMarshall IslandsMauritaniaMauritiusMexicoMiddle East & North AfricaMiddle East & North Africa (excluding high income)Middle East & North Africa (IDA & IBRD countries)MoldovaMongoliaMoroccoMyanmarNamibiaNauruNepalNicaraguaNigerOmanOther small statesPacific island small statesPanamaParaguayPre-demographic dividendQatarRwandaSamoaSao Tome and PrincipeSaudi ArabiaSenegalSerbiaSeychellesSierra LeoneSmall statesSolomon IslandsSouth AfricaSouth SudanSt. Kitts and NevisSt. LuciaSt. Vincent and the GrenadinesSub-Saharan Africa Sub-Saharan Africa (excluding high income)Sub-Saharan Africa (IDA & IBRD countries)SurinameSwazilandSyrian Arab RepublicTajikistanTanzaniaTogoTongaTrinidad and TobagoTunisiaTuvaluUnited Arab EmiratesUzbekistanVanuatuVietnamWest Bank and GazaZimbabwe
línea de tiempo (timeline):
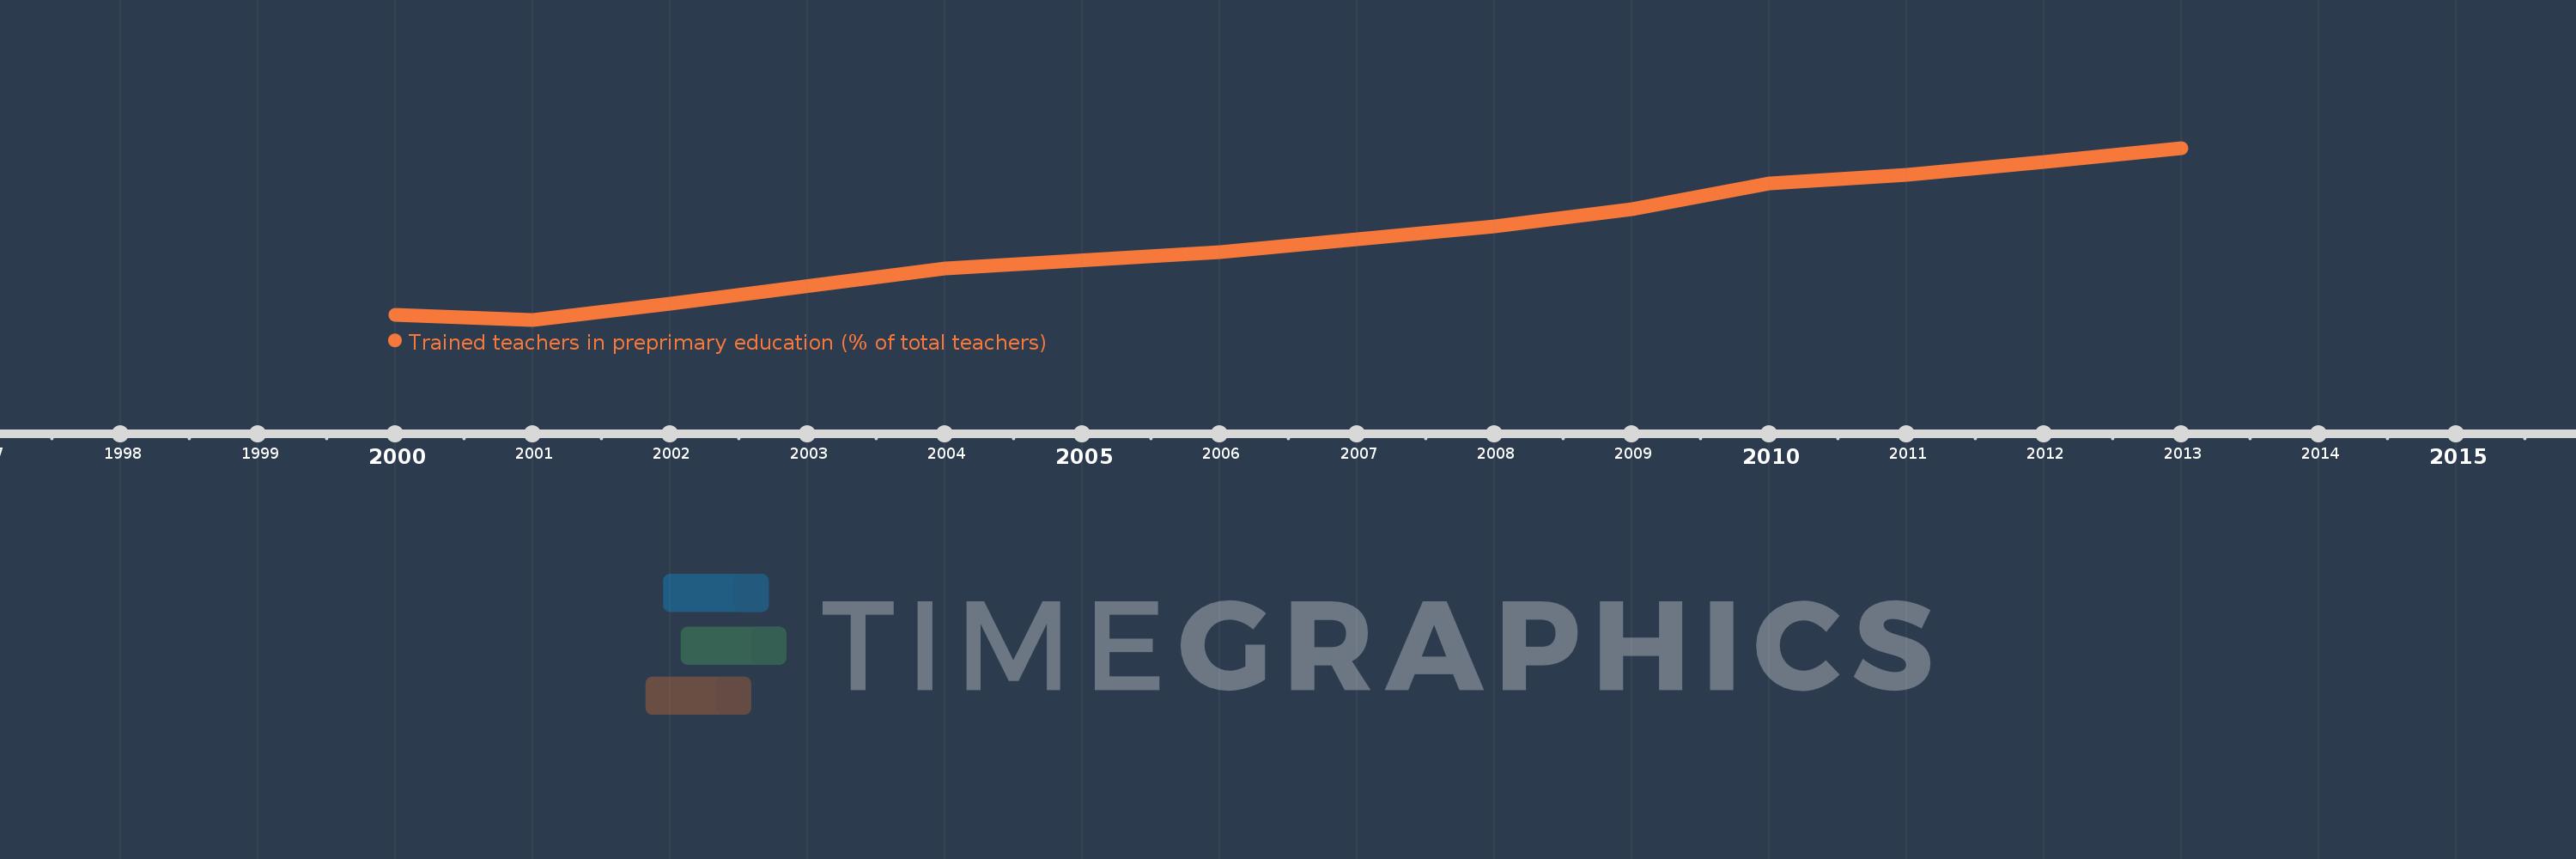
En esta escala de tiempo se presenta un gráfico de 2000 y 2013 de Guyana. Los datos de 1999 están ausentes. El número de observaciones reales por fecha: 11.
Fuente (nombre):
Indicadores del desarrollo mundial
Fuente (organización):
United Nations Educational, Scientific, and Cultural Organization (UNESCO) Institute for Statistics.
Categorías:
Education
Se ha actualizado:
23 abr 2017 año
Los indicadores de los cambios de valor en los últimos años
En promedio:
51.509
Mínimo:
37.579
1 ene 2001 año
Máximo:
65.171
1 ene 2013 año
A la fecha de observación
Valor
Cambio absoluto
El cambio con respecto al valor anterior
1 ene 2000 año
38.355
+38.355
0.0%
1 ene 2001 año
37.579
-0.776
-2.02%
1 ene 2002 año
40.108
+2.529
6.73%
1 ene 2004 año
45.865
+5.757
14.35%
1 ene 2006 año
48.425
+2.56
5.58%
1 ene 2008 año
52.536
+4.111
8.49%
1 ene 2009 año
55.342
+2.806
5.34%
1 ene 2010 año
59.431
+4.088
7.39%
1 ene 2011 año
60.85
+1.42
2.39%
1 ene 2012 año
62.935
+2.085
3.43%
1 ene 2013 año
65.171
+2.236
3.55%
Ranking de los países por los datos estadísticos actuales

Comentarios:

Enviar
PremiumAbout & FeedbackAcuerdoPrivacidad
logo
© 2022 Selected Technologies LLC – Morgan Hill, California