29
/es/
es
AIzaSyAYiBZKx7MnpbEhh9jyipgxe19OcubqV5w
April 1, 2024
111836
Costa Rica
CRI
true
2
1
Adolescents out of school, female (% of female lower secondary school age)
2015,2014,2013,2012,1992,1991,1990,1988,1987,1986,1983,1982,1980,1977,1976,1974,1971
Download
Estadísticas Globales de la Biblioteca →Costa Rica →

Adolescents out of school, female (% of female lower secondary school age)

Estas estadísticas en otros países:
AfghanistanAlbaniaAlgeriaAngolaAntigua and BarbudaArab WorldArgentinaArmeniaArubaAustraliaAzerbaijanBahamas, TheBahrainBangladeshBarbadosBelarusBelgiumBelizeBeninBermudaBhutanBoliviaBotswanaBrazilBrunei DarussalamBulgariaBurkina FasoBurundiCabo VerdeCambodiaCameroonCanadaCaribbean small statesCentral African RepublicCentral Europe and the BalticsChadChileColombiaComorosCongo, Dem. Rep.Congo, Rep.Costa RicaCroatiaCubaCyprusDenmarkDjiboutiDominicaDominican RepublicEarly-demographic dividendEast Asia & PacificEast Asia & Pacific (excluding high income)East Asia & Pacific (IDA & IBRD countries)EcuadorEgypt, Arab Rep.El SalvadorEritreaEstoniaEthiopiaEuro areaEurope & Central AsiaEurope & Central Asia (excluding high income)Europe & Central Asia (IDA & IBRD countries)European UnionFijiFinlandFragile and conflict affected situationsFranceGambia, TheGeorgiaGhanaGreeceGrenadaGuatemalaGuineaGuinea-BissauGuyanaHeavily indebted poor countries (HIPC)High incomeHondurasHong Kong SAR, ChinaHungaryIBRD onlyIcelandIDA & IBRD totalIDA blendIDA onlyIDA totalIndiaIndonesiaIran, Islamic Rep.IraqIrelandItalyJamaicaJordanKazakhstanKenyaKiribatiKorea, Rep.KuwaitKyrgyz RepublicLao PDRLate-demographic dividendLatin America & Caribbean Latin America & Caribbean (excluding high income)Latin America & the Caribbean (IDA & IBRD countries)LatviaLeast developed countries: UN classificationLebanonLesothoLibyaLiechtensteinLithuaniaLow & middle incomeLow incomeLower middle incomeLuxembourgMacao SAR, ChinaMacedonia, FYRMadagascarMalawiMaldivesMaliMaltaMauritaniaMauritiusMexicoMiddle East & North AfricaMiddle East & North Africa (excluding high income)Middle East & North Africa (IDA & IBRD countries)Middle incomeMoldovaMongoliaMoroccoMozambiqueMyanmarNamibiaNauruNetherlandsNew ZealandNicaraguaNigerNorth AmericaNorwayOECD membersOmanOther small statesPacific island small statesPakistanPanamaParaguayPeruPhilippinesPolandPortugalPost-demographic dividendPre-demographic dividendPuerto RicoQatarRomaniaRussian FederationSamoaSao Tome and PrincipeSaudi ArabiaSenegalSerbiaSeychellesSierra LeoneSloveniaSmall statesSolomon IslandsSomaliaSouth AfricaSouth AsiaSouth Asia (IDA & IBRD)SpainSri LankaSt. Kitts and NevisSt. LuciaSt. Vincent and the GrenadinesSub-Saharan Africa Sub-Saharan Africa (excluding high income)Sub-Saharan Africa (IDA & IBRD countries)SudanSurinameSwazilandSwedenSwitzerlandSyrian Arab RepublicTajikistanThailandTimor-LesteTogoTongaTrinidad and TobagoTunisiaTurkeyTuvaluUgandaUkraineUnited Arab EmiratesUnited KingdomUnited StatesUpper middle incomeUruguayVanuatuVenezuela, RBWest Bank and GazaWorldYemen, Rep.Zimbabwe
línea de tiempo (timeline):
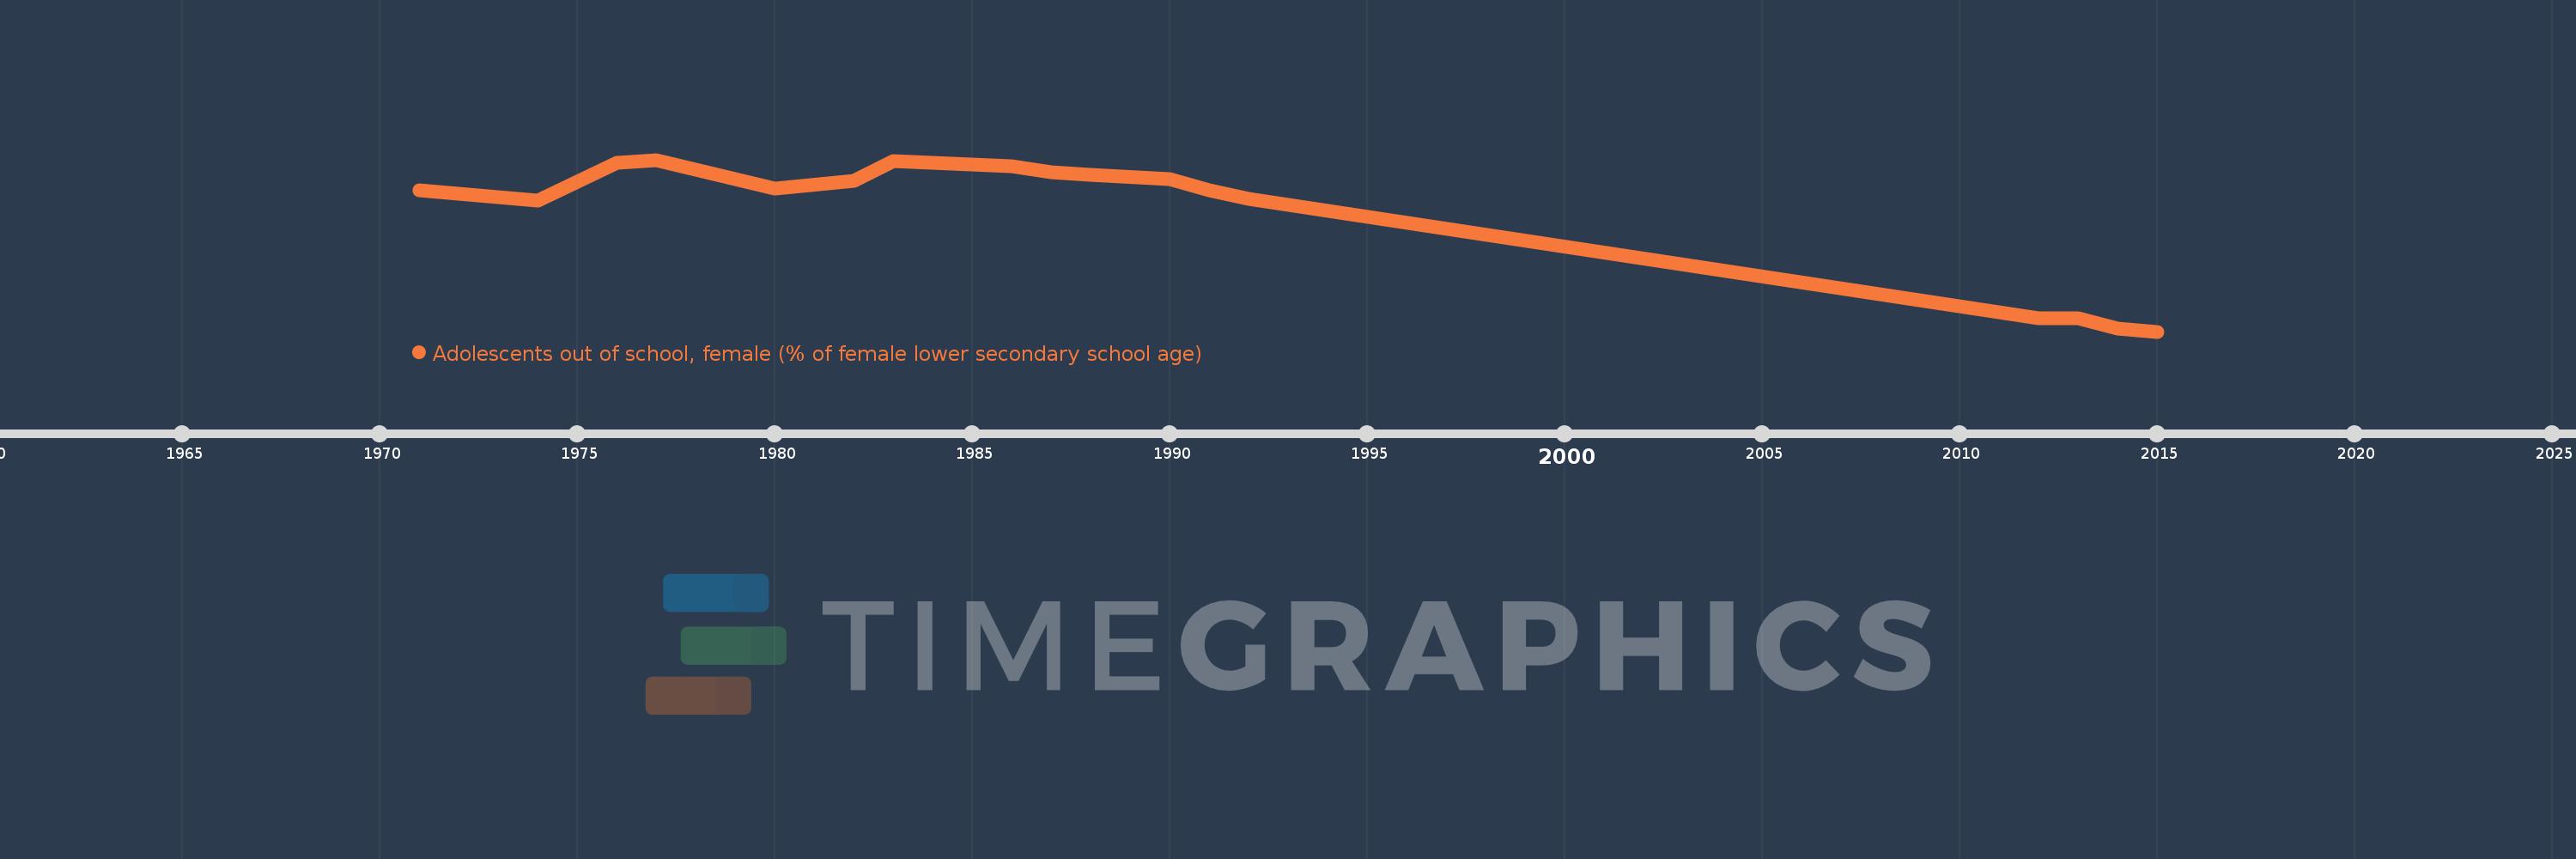
En esta escala de tiempo se presenta un gráfico de 1971 y 2015 de Costa Rica. Los datos de 1970 están ausentes. El número de observaciones reales por fecha: 17.
Fuente (nombre):
Indicadores del desarrollo mundial
Fuente (organización):
United Nations Educational, Scientific, and Cultural Organization (UNESCO) Institute for Statistics.
Categorías:
Education
Se ha actualizado:
23 abr 2017 año
Los indicadores de los cambios de valor en los últimos años
En promedio:
27.105
Mínimo:
6.008
1 ene 2015 año
Máximo:
36.587
1 ene 1977 año
A la fecha de observación
Valor
Cambio absoluto
El cambio con respecto al valor anterior
1 ene 1971 año
31.171
+31.171
0.0%
1 ene 1974 año
29.255
-1.916
-6.15%
1 ene 1976 año
35.984
+6.729
23.0%
1 ene 1977 año
36.587
+0.603
1.68%
1 ene 1980 año
31.446
-5.141
-14.05%
1 ene 1982 año
32.899
+1.453
4.62%
1 ene 1983 año
36.36
+3.461
10.52%
1 ene 1986 año
35.477
-0.883
-2.43%
1 ene 1987 año
34.337
-1.14
-3.21%
1 ene 1988 año
33.908
-0.429
-1.25%
1 ene 1990 año
33.146
-0.762
-2.25%
1 ene 1991 año
31.218
-1.927
-5.81%
1 ene 1992 año
29.606
-1.612
-5.16%
1 ene 2012 año
8.388
-21.218
-71.67%
1 ene 2013 año
8.437
+0.049
0.58%
1 ene 2014 año
6.566
-1.871
-22.18%
1 ene 2015 año
6.008
-0.558
-8.49%
Ranking de los países por los datos estadísticos actuales

Comentarios:

Enviar
PremiumAbout & FeedbackAcuerdoPrivacidad
logo
© 2022 Selected Technologies LLC – Morgan Hill, California