33
/es/
AIzaSyB4mHJ5NPEv-XzF7P6NDYXjlkCWaeKw5bc
November 30, 2025
110306
Congo, Dem. Rep.
COD
true
2
1
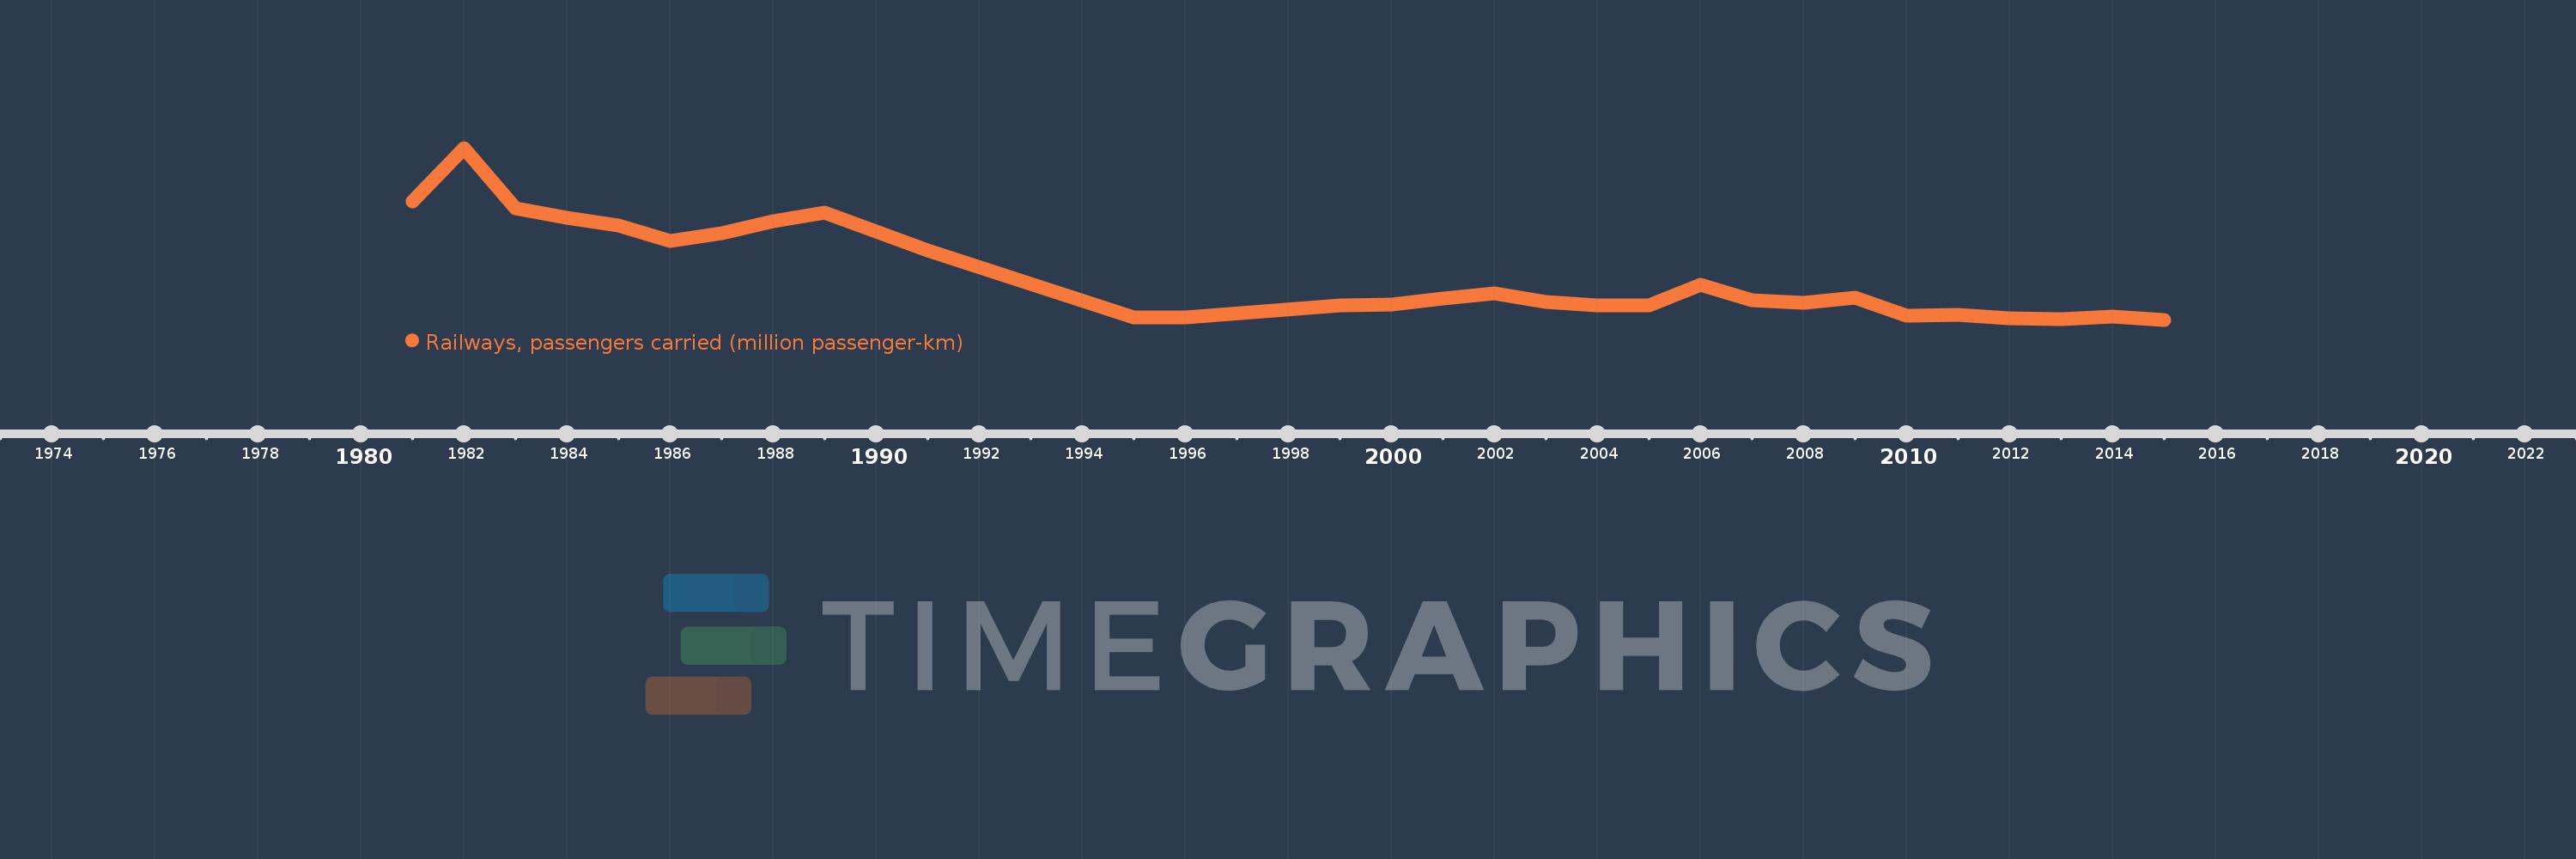
Railways, passengers carried (million passenger-km)
2015,2014,2013,2012,2011,2010,2009,2008,2007,2006,2005,2004,2003,2002,2001,2000,1999,1996,1995,1991,1989,1988,1987,1986,1985,1984,1983,1982,1981