29
/de/
de
AIzaSyAYiBZKx7MnpbEhh9jyipgxe19OcubqV5w
April 1, 2024
79908
Barbados
BRB
true
2
1
Pupil-teacher ratio in primary education (headcount basis)
2015,2012,2011,2010,2009,2008,2006,2005,2004,2003,2002,2001,2000,1993,1991,1990,1986,1985,1984,1980,1979
Download
Bibliothek der Globalstatistik →Barbados →

Pupil-teacher ratio in primary education (headcount basis)

Diese Statistik in anderen Ländern:
AfghanistanAlbaniaAlgeriaAndorraAngolaAntigua and BarbudaArab WorldArgentinaArmeniaArubaAustraliaAustriaAzerbaijanBahamas, TheBahrainBangladeshBarbadosBelarusBelgiumBelizeBeninBermudaBhutanBoliviaBosnia and HerzegovinaBotswanaBrazilBritish Virgin IslandsBrunei DarussalamBulgariaBurkina FasoBurundiCabo VerdeCambodiaCameroonCanadaCaribbean small statesCayman IslandsCentral African RepublicCentral Europe and the BalticsChadChileChinaColombiaComorosCongo, Dem. Rep.Congo, Rep.Costa RicaCote d'IvoireCroatiaCubaCyprusCzech RepublicDenmarkDjiboutiDominicaDominican RepublicEarly-demographic dividendEast Asia & PacificEast Asia & Pacific (excluding high income)East Asia & Pacific (IDA & IBRD countries)EcuadorEgypt, Arab Rep.El SalvadorEquatorial GuineaEritreaEstoniaEthiopiaEuro areaEurope & Central AsiaEurope & Central Asia (excluding high income)Europe & Central Asia (IDA & IBRD countries)European UnionFijiFinlandFragile and conflict affected situationsFranceGabonGambia, TheGeorgiaGermanyGhanaGibraltarGreeceGrenadaGuatemalaGuineaGuinea-BissauGuyanaHaitiHeavily indebted poor countries (HIPC)High incomeHondurasHong Kong SAR, ChinaHungaryIBRD onlyIcelandIDA & IBRD totalIDA blendIDA onlyIDA totalIndiaIndonesiaIran, Islamic Rep.IraqIrelandIsraelItalyJamaicaJapanJordanKazakhstanKenyaKiribatiKorea, Dem. People’s Rep.Korea, Rep.KuwaitKyrgyz RepublicLao PDRLate-demographic dividendLatin America & Caribbean Latin America & Caribbean (excluding high income)Latin America & the Caribbean (IDA & IBRD countries)LatviaLeast developed countries: UN classificationLebanonLesothoLiberiaLibyaLiechtensteinLithuaniaLow & middle incomeLow incomeLower middle incomeLuxembourgMacao SAR, ChinaMacedonia, FYRMadagascarMalawiMalaysiaMaldivesMaliMaltaMarshall IslandsMauritaniaMauritiusMexicoMicronesia, Fed. Sts.Middle East & North AfricaMiddle East & North Africa (excluding high income)Middle East & North Africa (IDA & IBRD countries)Middle incomeMoldovaMonacoMongoliaMoroccoMozambiqueMyanmarNamibiaNauruNepalNetherlandsNew ZealandNicaraguaNigerNigeriaNorth AmericaNorwayOECD membersOmanOther small statesPacific island small statesPakistanPalauPanamaPapua New GuineaParaguayPeruPhilippinesPolandPortugalPost-demographic dividendPre-demographic dividendPuerto RicoQatarRomaniaRussian FederationRwandaSamoaSan MarinoSao Tome and PrincipeSaudi ArabiaSenegalSerbiaSeychellesSierra LeoneSingaporeSint Maarten (Dutch part)Slovak RepublicSloveniaSmall statesSolomon IslandsSomaliaSouth AfricaSouth AsiaSouth Asia (IDA & IBRD)South SudanSpainSri LankaSt. Kitts and NevisSt. LuciaSt. Vincent and the GrenadinesSub-Saharan Africa Sub-Saharan Africa (excluding high income)Sub-Saharan Africa (IDA & IBRD countries)SudanSurinameSwazilandSwedenSwitzerlandSyrian Arab RepublicTajikistanTanzaniaThailandTimor-LesteTogoTongaTrinidad and TobagoTunisiaTurkeyTurks and Caicos IslandsTuvaluUgandaUkraineUnited Arab EmiratesUnited KingdomUnited StatesUpper middle incomeUruguayUzbekistanVanuatuVenezuela, RBVietnamWest Bank and GazaWorldYemen, Rep.ZambiaZimbabwe
Zeitlinie:
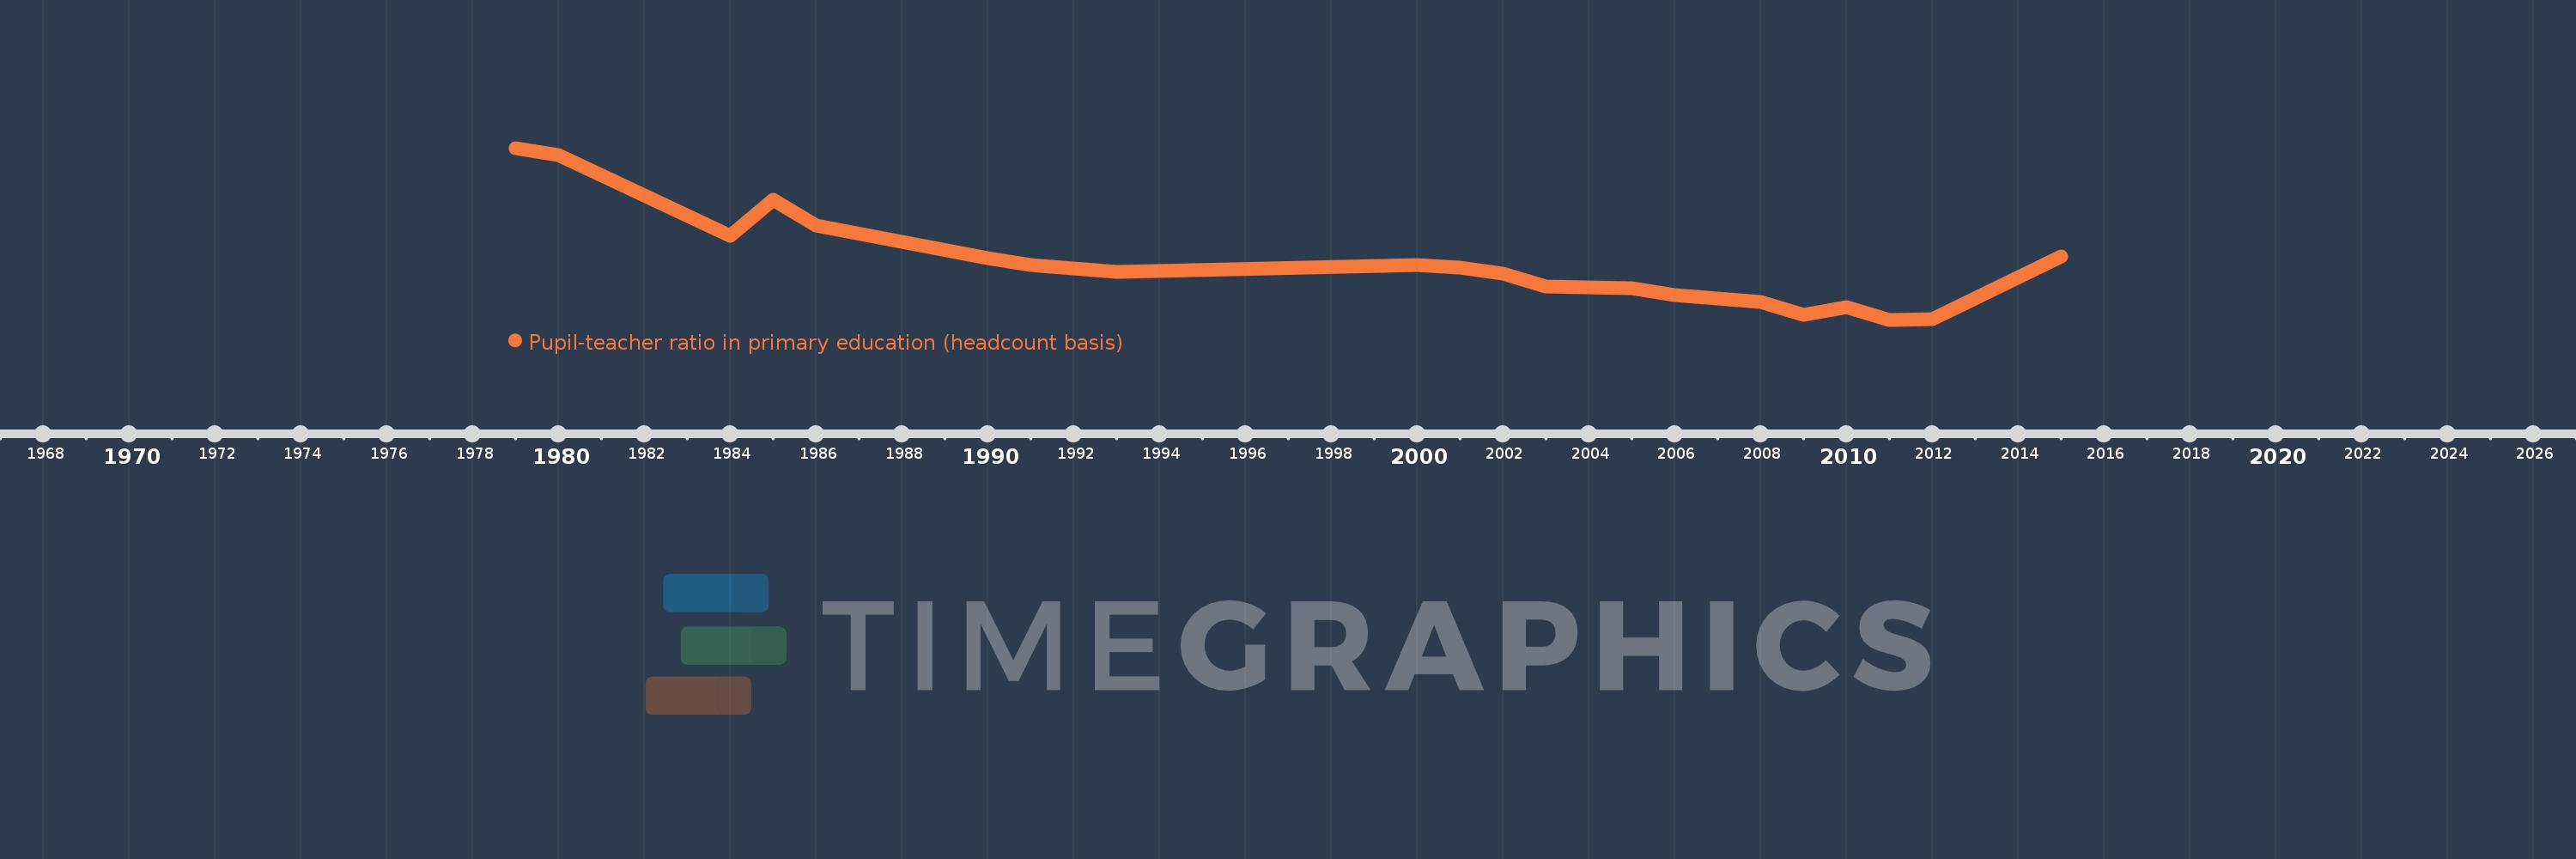
Diese Zeitleiste vorliegt die Graphik ab 1979 J. bis 2015 J. Barbados. Die Angaben bis 1978 J. sind nicht vorhanden. Die Zahl aktueller Beobachtungen nach Daten: 21.
Die Quelle (Bezeichnung):
Kennzahlen der Weltentwicklung
Die Quelle (Einrichtung):
UNESCO Institute for Statistics
Kategorien:
Education
Es wurde aktualisiert:
23 Apr 2017 Jahr
Kennzahlen der Wertänderungen vom Jahr zum Jahr
im Durchschnitt:
17.879
Minimum:
13.007
1 Jan 2011 Jahr
Maximum:
27.974
1 Jan 1979 Jahr
Zum Datum der Beobachtung
Wert
Absolute Veränderung
Die Veränderung bezüglich dem vorherigen Wert
1 Jan 1979 Jahr
27.974
+27.974
0.0%
1 Jan 1980 Jahr
27.388
-0.586
-2.1%
1 Jan 1984 Jahr
20.333
-7.055
-25.76%
1 Jan 1985 Jahr
23.468
+3.135
15.42%
1 Jan 1986 Jahr
21.225
-2.243
-9.56%
1 Jan 1990 Jahr
18.387
-2.839
-13.37%
1 Jan 1991 Jahr
17.8
-0.586
-3.19%
1 Jan 1993 Jahr
17.168
-0.632
-3.55%
1 Jan 2000 Jahr
17.772
+0.604
3.52%
1 Jan 2001 Jahr
17.57
-0.202
-1.14%
1 Jan 2002 Jahr
17.036
-0.534
-3.04%
1 Jan 2003 Jahr
15.903
-1.132
-6.65%
1 Jan 2004 Jahr
15.804
-0.099
-0.62%
1 Jan 2005 Jahr
15.768
-0.036
-0.23%
1 Jan 2006 Jahr
15.146
-0.622
-3.94%
1 Jan 2008 Jahr
14.542
-0.604
-3.98%
1 Jan 2009 Jahr
13.456
-1.086
-7.47%
1 Jan 2010 Jahr
14.142
+0.686
5.1%
1 Jan 2011 Jahr
13.007
-1.135
-8.03%
1 Jan 2012 Jahr
13.087
+0.079
0.61%
1 Jan 2015 Jahr
18.49
+5.403
41.29%
Bewertung der Länder gemäß mit laufender Statistik nach Jahren

Kommentare:

Abschicken
PremiumAbout & FeedbackVereinbarungPrivatheit
logo
© 2022 Selected Technologies LLC – Morgan Hill, California