33
/de/
AIzaSyB4mHJ5NPEv-XzF7P6NDYXjlkCWaeKw5bc
November 1, 2025
234134
Sao Tome and Principe
STP
true
2
1
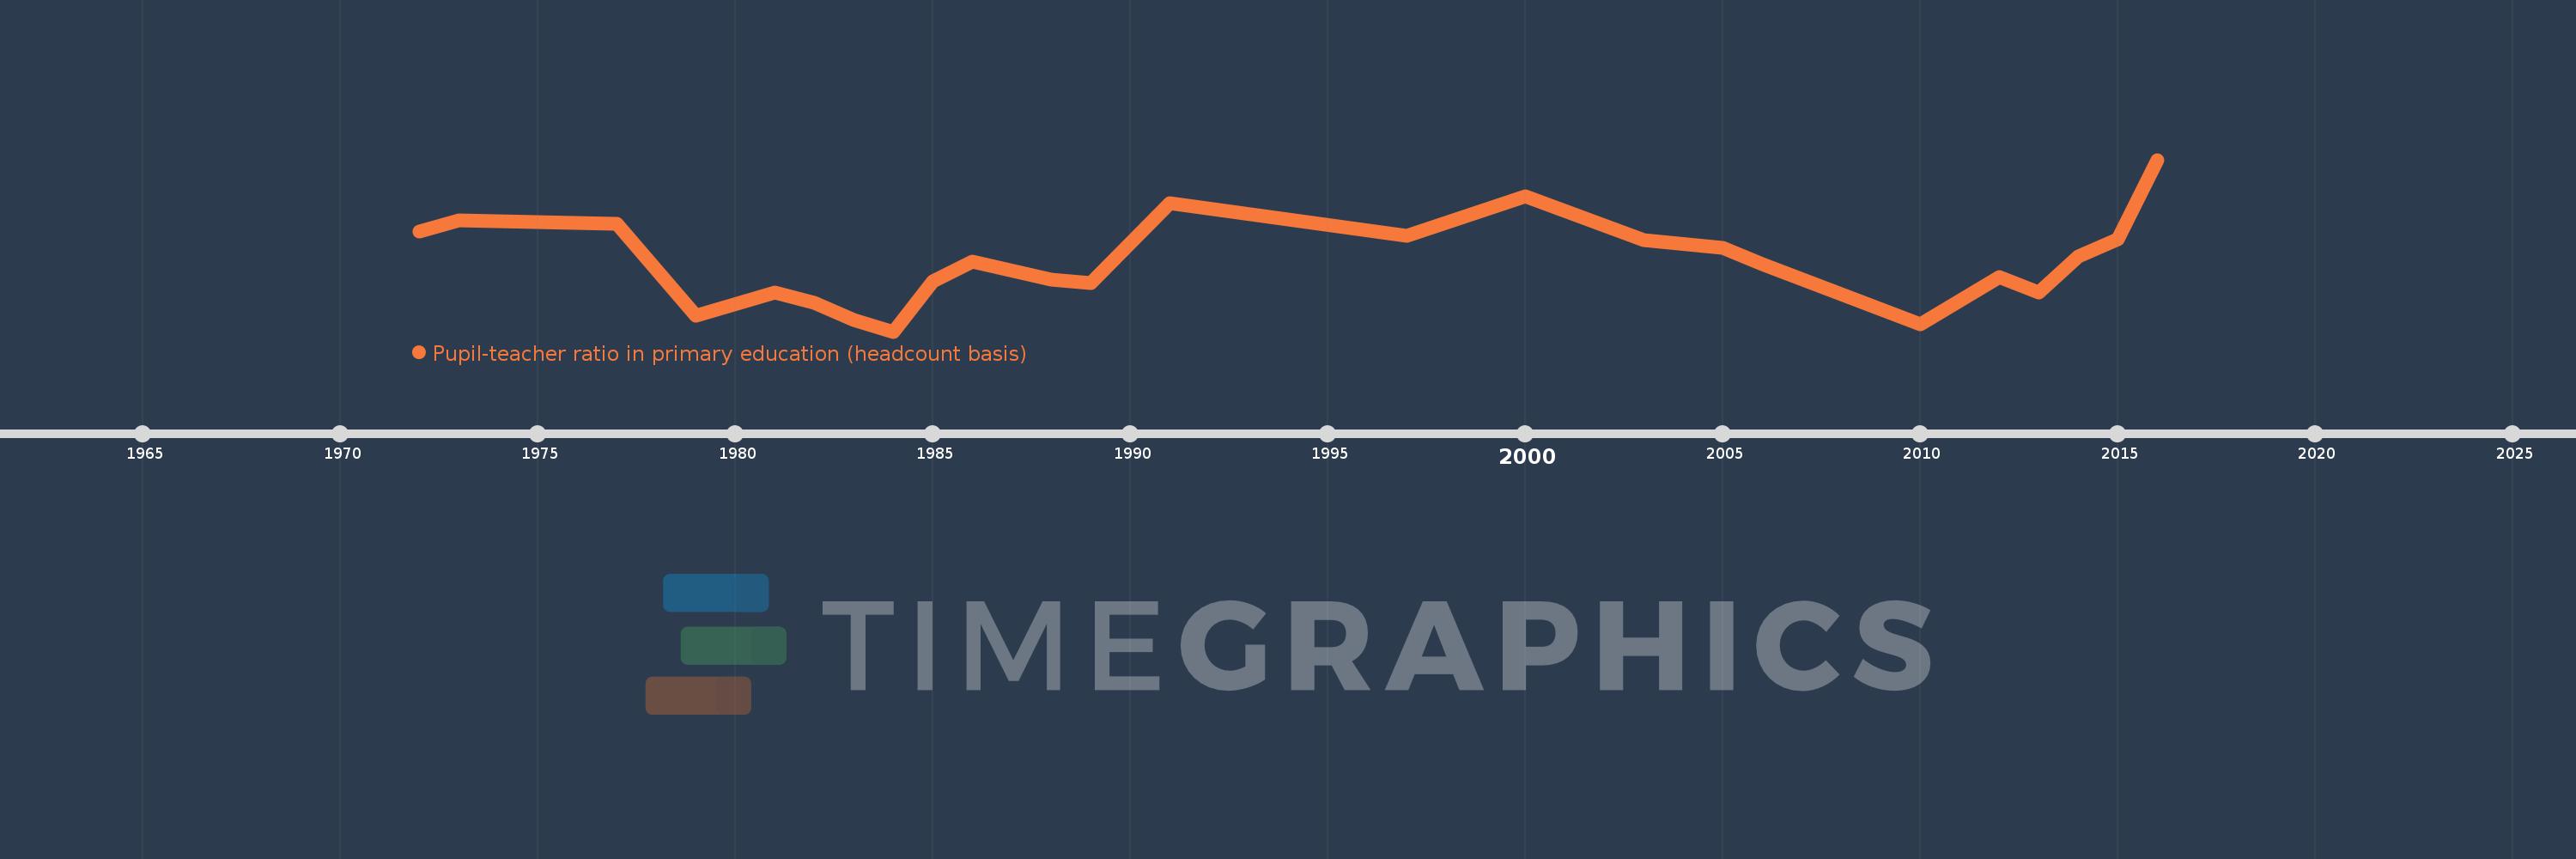
Pupil-teacher ratio in primary education (headcount basis)
2016,2015,2014,2013,2012,2010,2006,2005,2003,2000,1997,1991,1989,1988,1986,1985,1984,1983,1982,1981,1979,1977,1973,1972