33
/de/
AIzaSyB4mHJ5NPEv-XzF7P6NDYXjlkCWaeKw5bc
November 30, 2025
252426
St. Vincent and the Grenadines
VCT
true
2
1
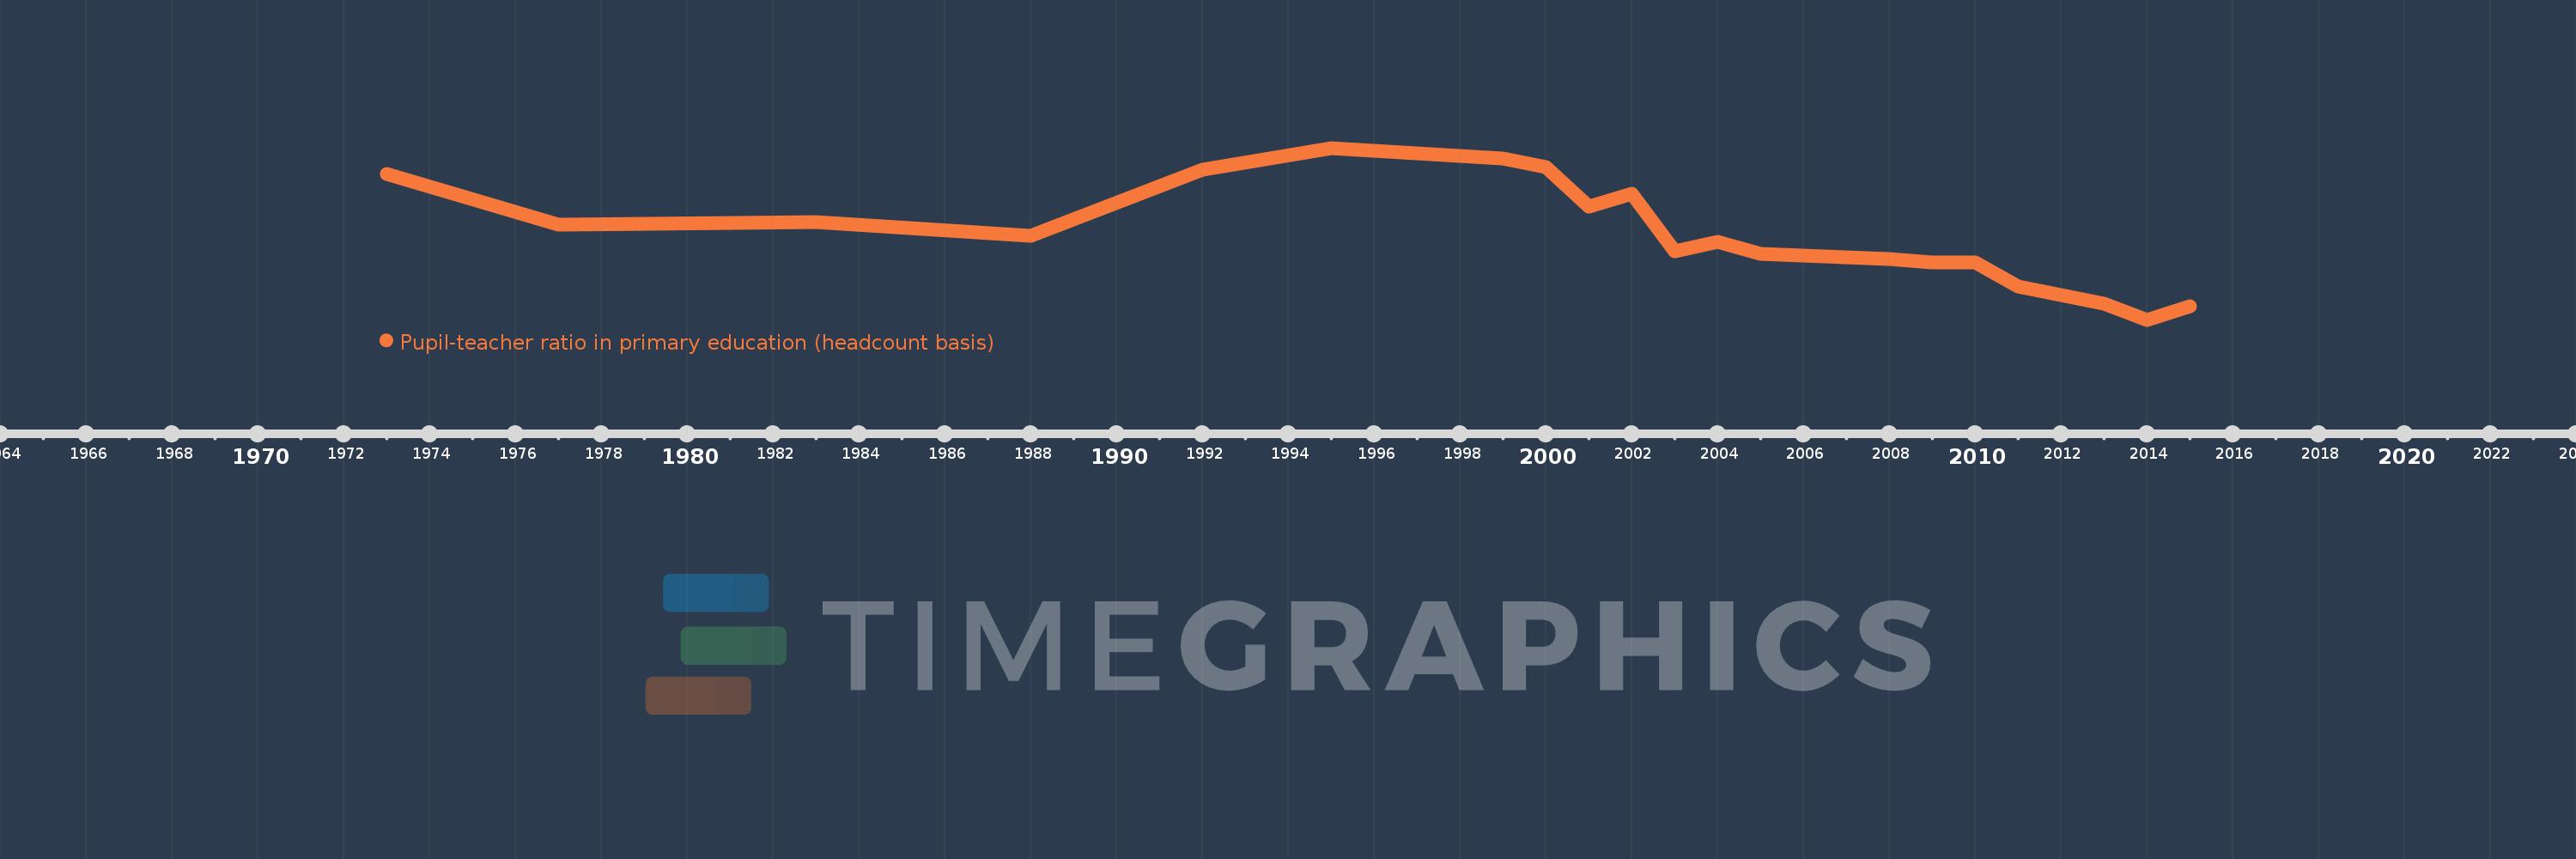
Pupil-teacher ratio in primary education (headcount basis)
2015,2014,2013,2011,2010,2009,2008,2005,2004,2003,2002,2001,2000,1999,1995,1992,1988,1983,1977,1973