33
/de/
AIzaSyB4mHJ5NPEv-XzF7P6NDYXjlkCWaeKw5bc
November 30, 2025
110301
Congo, Dem. Rep.
COD
true
2
1
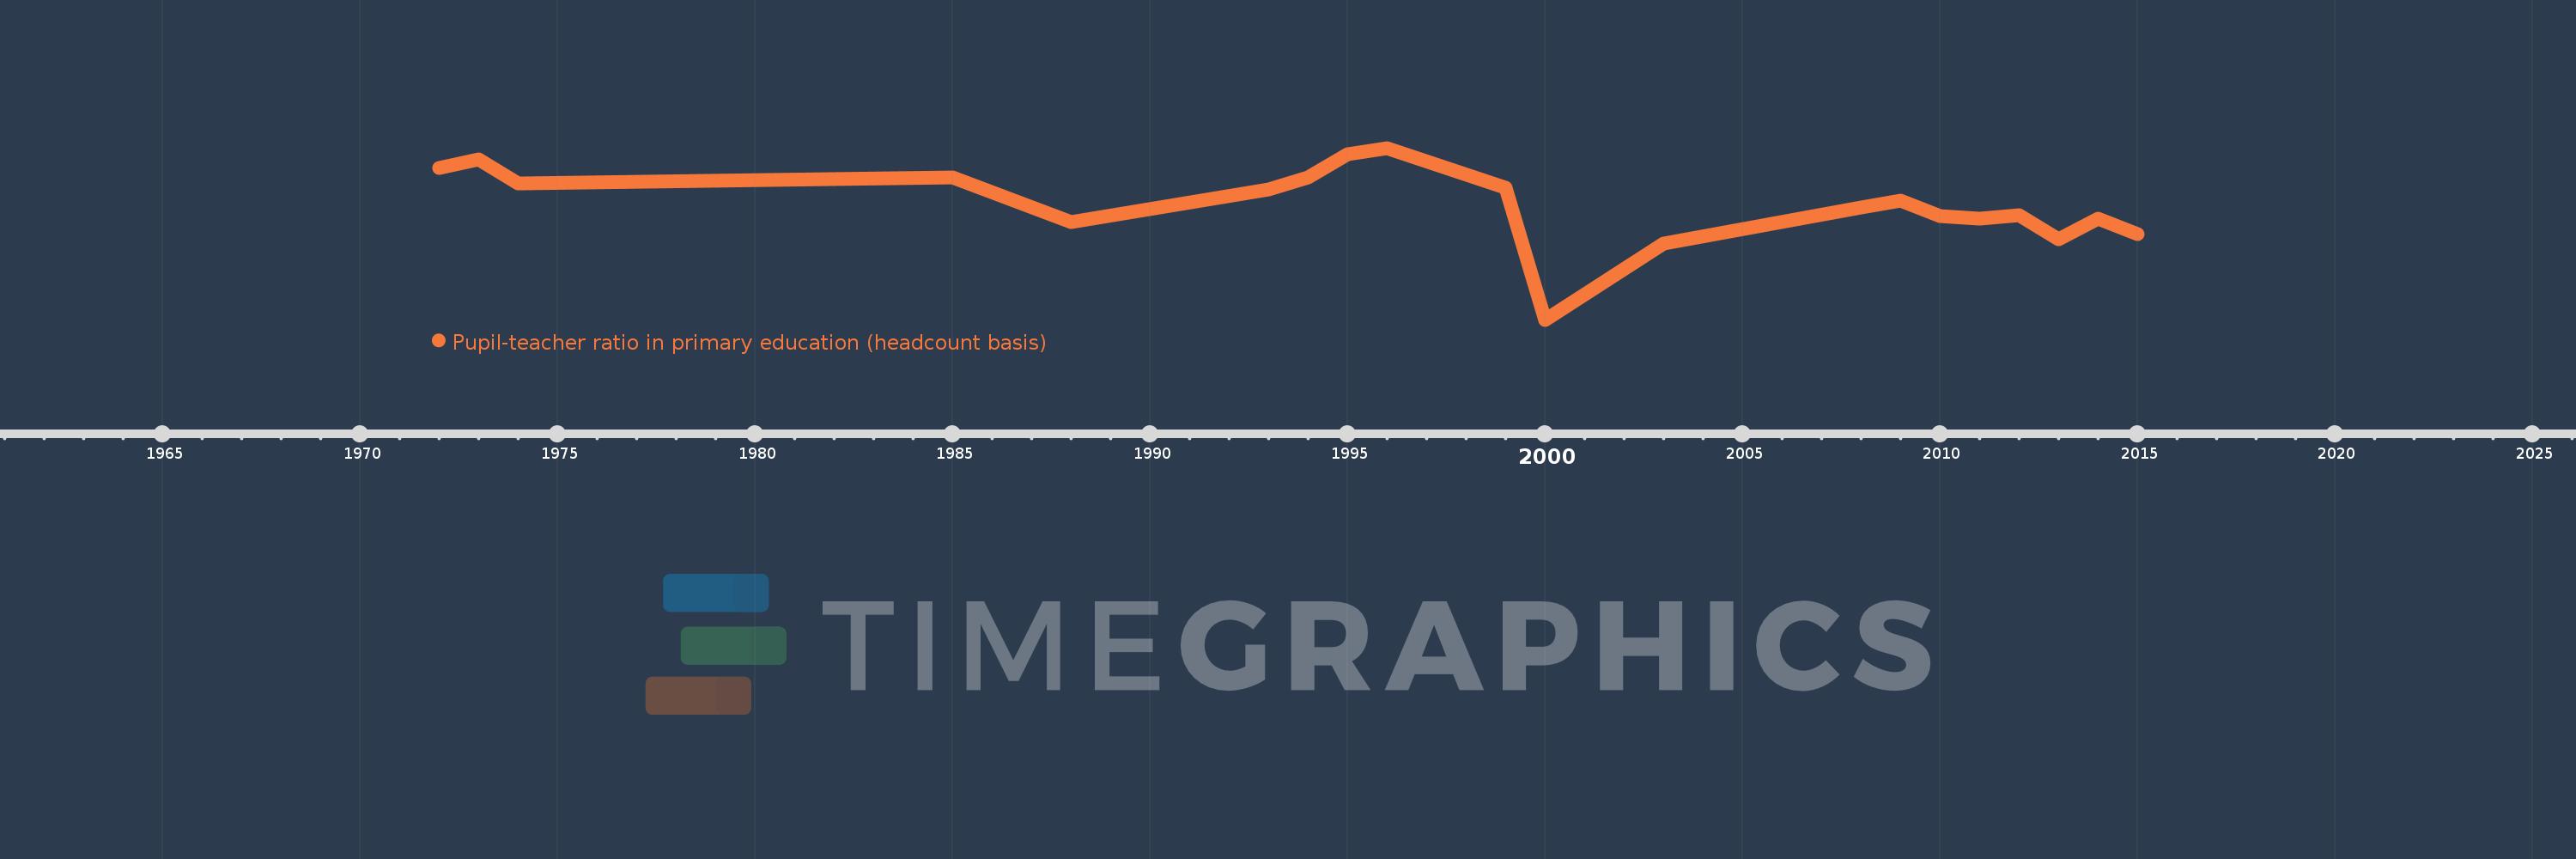
Pupil-teacher ratio in primary education (headcount basis)
2015,2014,2013,2012,2011,2010,2009,2008,2003,2000,1999,1996,1995,1994,1993,1988,1985,1974,1973,1972