33
/de/
AIzaSyB4mHJ5NPEv-XzF7P6NDYXjlkCWaeKw5bc
November 30, 2025
70151
Argentina
ARG
true
2
1
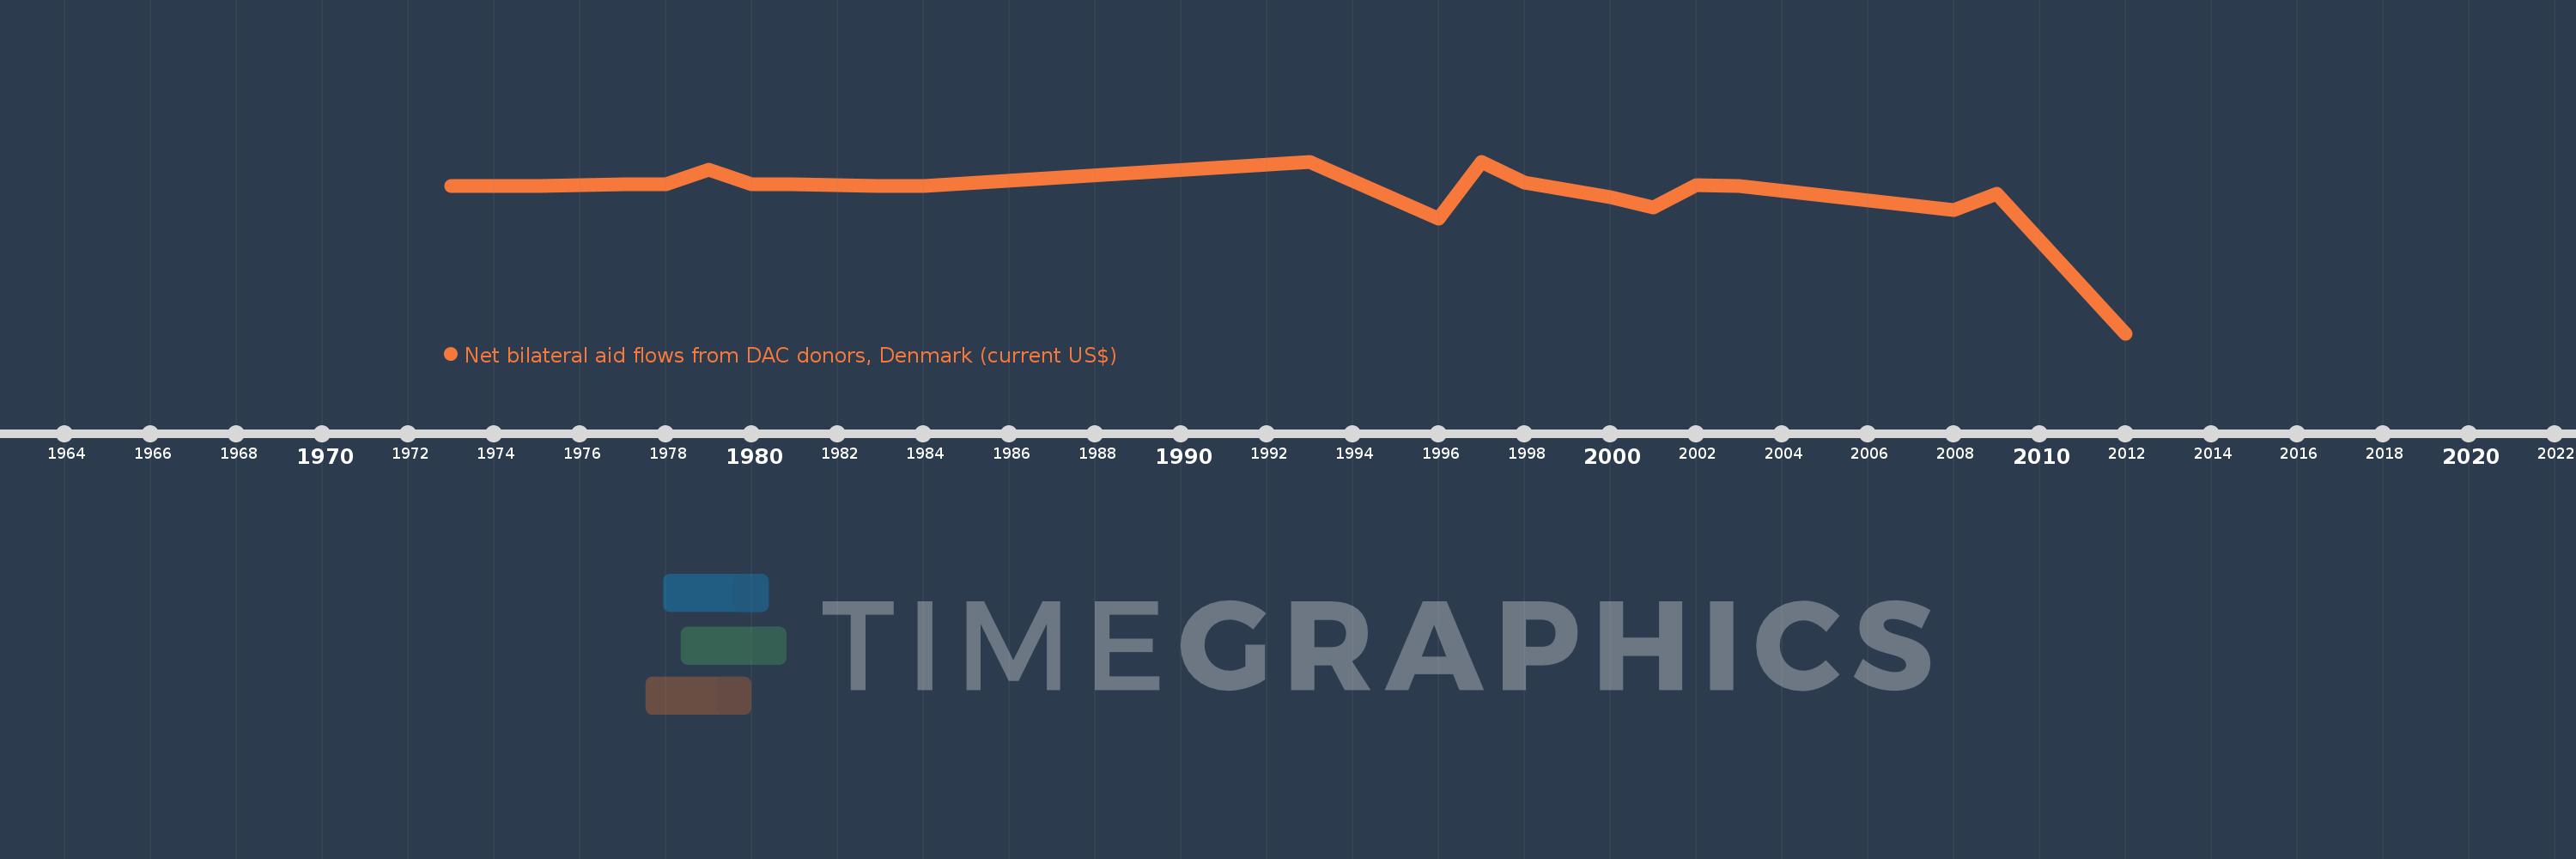
Net bilateral aid flows from DAC donors, Denmark (current US$)
2012,2009,2008,2003,2002,2001,2000,1998,1997,1996,1993,1984,1983,1982,1981,1980,1979,1978,1977,1976,1975,1974,1973