33
/de/
AIzaSyB4mHJ5NPEv-XzF7P6NDYXjlkCWaeKw5bc
November 30, 2025
54262
Pacific island small states
PSS
false
2
1
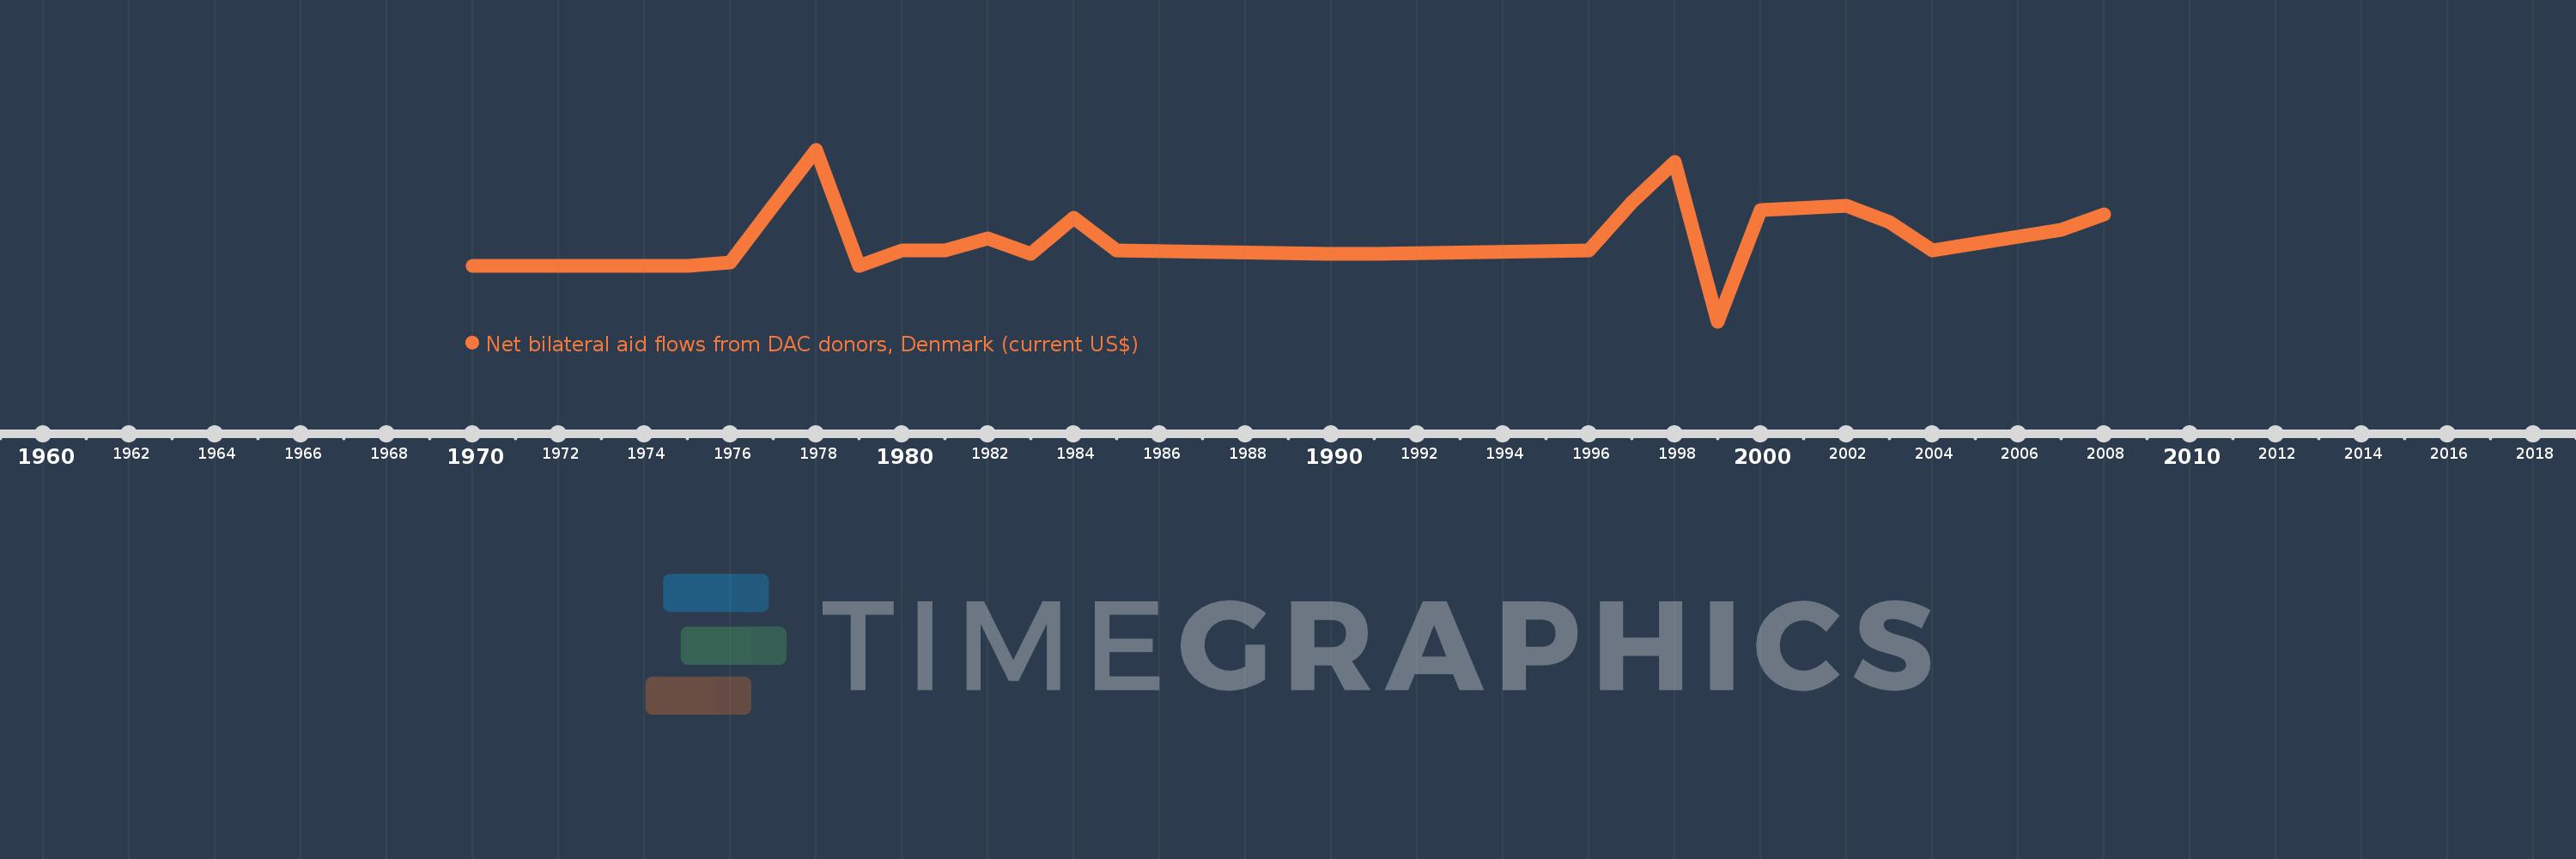
Net bilateral aid flows from DAC donors, Denmark (current US$)
2008,2007,2004,2003,2002,2000,1999,1998,1997,1996,1991,1990,1985,1984,1983,1982,1981,1980,1979,1978,1977,1976,1975,1974,1973,1970