33
/de/
AIzaSyB4mHJ5NPEv-XzF7P6NDYXjlkCWaeKw5bc
November 1, 2025
258631
Syrian Arab Republic
SYR
true
2
1
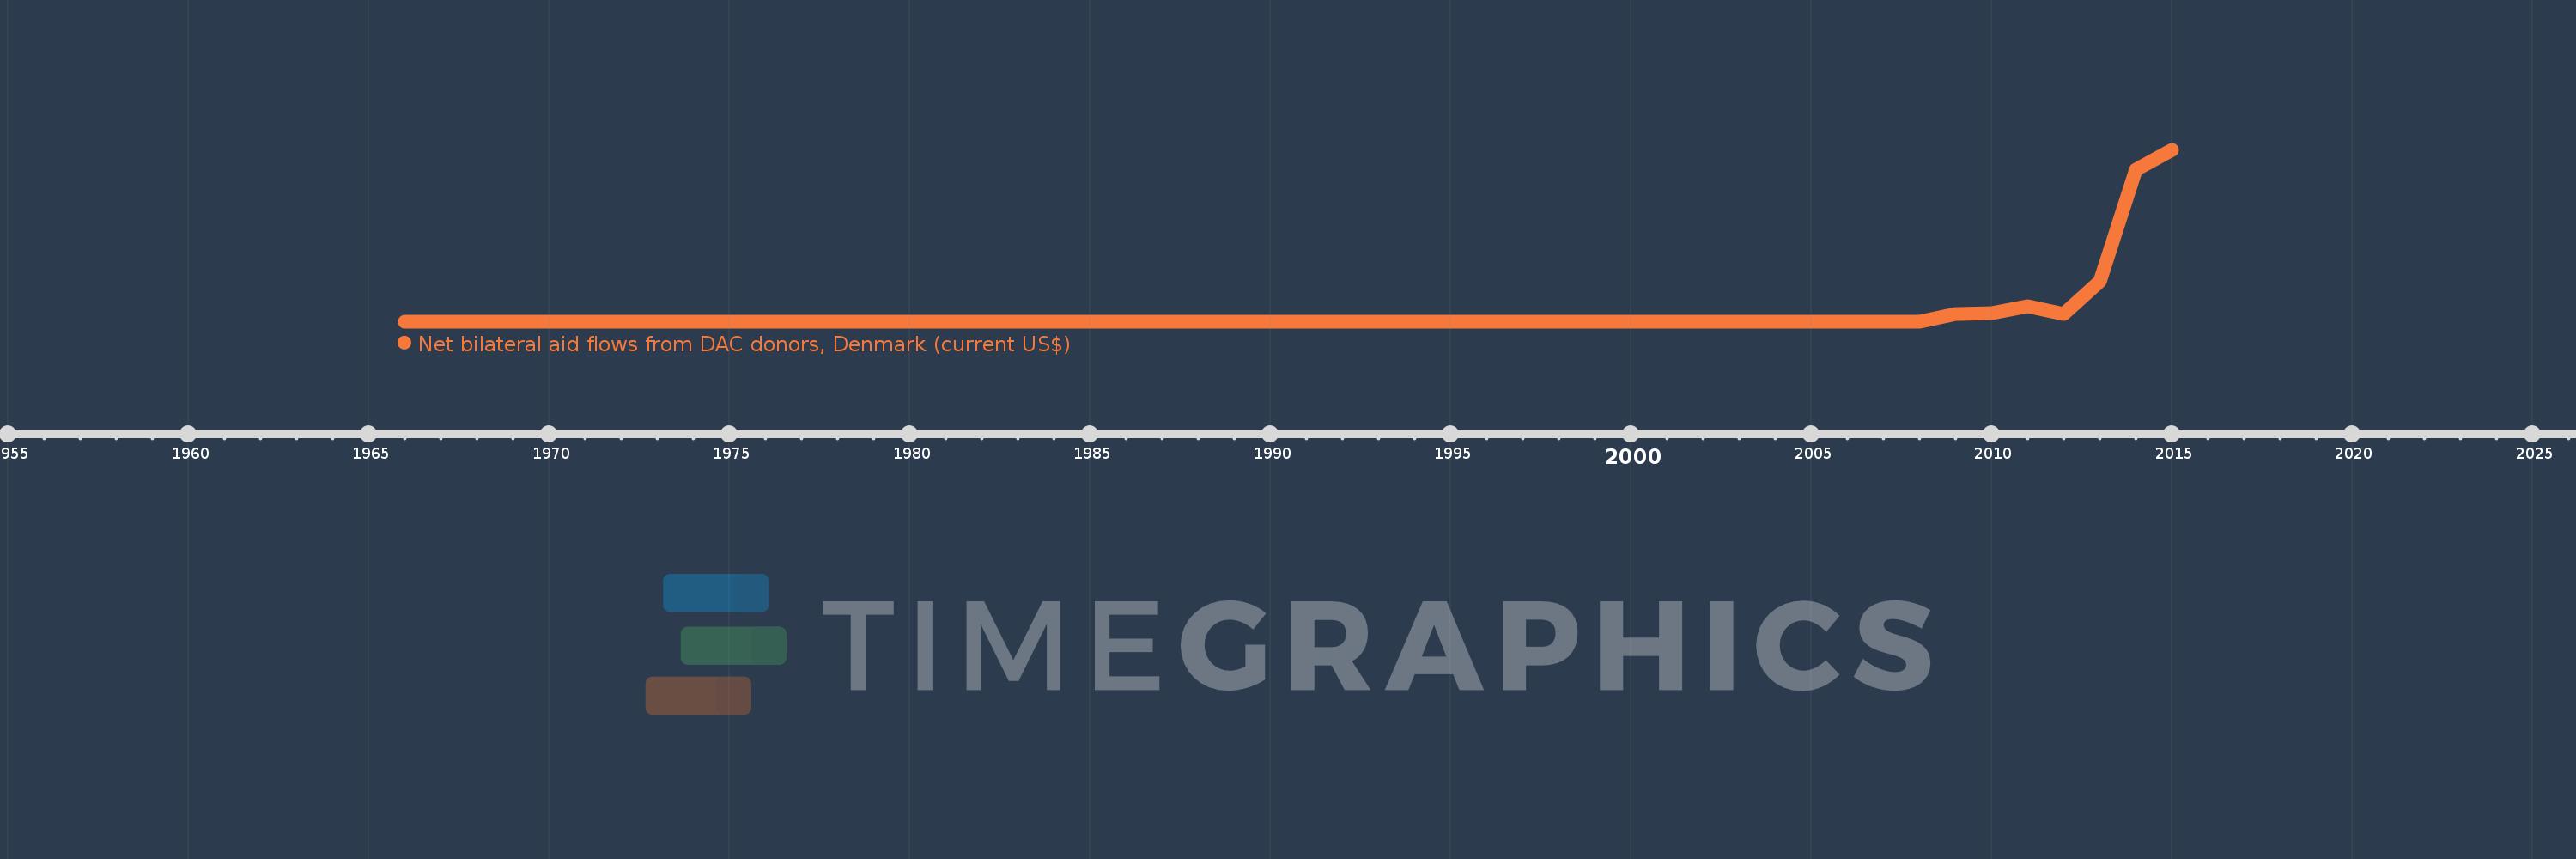
Net bilateral aid flows from DAC donors, Denmark (current US$)
2015,2014,2013,2012,2011,2010,2009,2008,2004,1989,1988,1981,1972,1971,1970,1969,1968,1967,1966