33
/de/
AIzaSyAYiBZKx7MnpbEhh9jyipgxe19OcubqV5w
August 1, 2025
184204
Macedonia, FYR
MKD
true
2
1
Net bilateral aid flows from DAC donors, Denmark (current US$)
2015,2014,2013,2012,2011,2010,2008,2007,2006,2005,2004,2003,2002,2001,2000,1999,1998
Download
Bibliothek der Globalstatistik →Macedonia, FYR →

Net bilateral aid flows from DAC donors, Denmark (current US$)

Diese Statistik in anderen Ländern:

AfghanistanAlbaniaAlgeriaAngolaArab WorldArgentinaArmeniaAzerbaijanBahrainBangladeshBelarusBelizeBeninBhutanBoliviaBosnia and HerzegovinaBotswanaBrazilBulgariaBurkina FasoBurundiCabo VerdeCambodiaCameroonCaribbean small statesCentral African RepublicCentral Europe and the BalticsChadChileChinaColombiaComorosCongo, Dem. Rep.Congo, Rep.Costa RicaCote d'IvoireCroatiaCubaCyprusCzech RepublicDjiboutiDominicaDominican RepublicEast Asia & PacificEast Asia & Pacific (excluding high income)East Asia & Pacific (IDA & IBRD countries)EcuadorEgypt, Arab Rep.El SalvadorEritreaEstoniaEthiopiaEuro areaEurope & Central AsiaEurope & Central Asia (excluding high income)Europe & Central Asia (IDA & IBRD countries)European UnionFijiFragile and conflict affected situationsGambia, TheGeorgiaGhanaGrenadaGuatemalaGuineaGuinea-BissauGuyanaHaitiHeavily indebted poor countries (HIPC)High incomeHondurasHungaryIBRD onlyIDA & IBRD totalIDA blendIDA onlyIDA totalIndiaIndonesiaIran, Islamic Rep.IraqIsraelJamaicaJordanKazakhstanKenyaKorea, Dem. People’s Rep.Korea, Rep.KosovoKuwaitKyrgyz RepublicLao PDRLatin America & Caribbean Latin America & Caribbean (excluding high income)Latin America & the Caribbean (IDA & IBRD countries)LatviaLeast developed countries: UN classificationLebanonLesothoLiberiaLibyaLithuaniaLow & middle incomeLow incomeLower middle incomeMacedonia, FYRMadagascarMalawiMalaysiaMaldivesMaliMaltaMauritaniaMauritiusMexicoMiddle East & North AfricaMiddle East & North Africa (excluding high income)Middle East & North Africa (IDA & IBRD countries)Middle incomeMoldovaMongoliaMontenegroMoroccoMozambiqueMyanmarNamibiaNepalNicaraguaNigerNigeriaOECD membersOmanOther small statesPacific island small statesPakistanPanamaPapua New GuineaParaguayPeruPhilippinesPolandRomaniaRussian FederationRwandaSamoaSenegalSerbiaSeychellesSierra LeoneSingaporeSlovak RepublicSloveniaSmall statesSolomon IslandsSomaliaSouth AfricaSouth AsiaSouth Asia (IDA & IBRD)South SudanSri LankaSub-Saharan Africa Sub-Saharan Africa (excluding high income)Sub-Saharan Africa (IDA & IBRD countries)SudanSwazilandSyrian Arab RepublicTajikistanTanzaniaThailandTimor-LesteTogoTongaTrinidad and TobagoTunisiaTurkeyTurkmenistanUgandaUkraineUpper middle incomeUruguayUzbekistanVanuatuVenezuela, RBVietnamWest Bank and GazaWorldYemen, Rep.ZambiaZimbabwe

Zeitlinie:

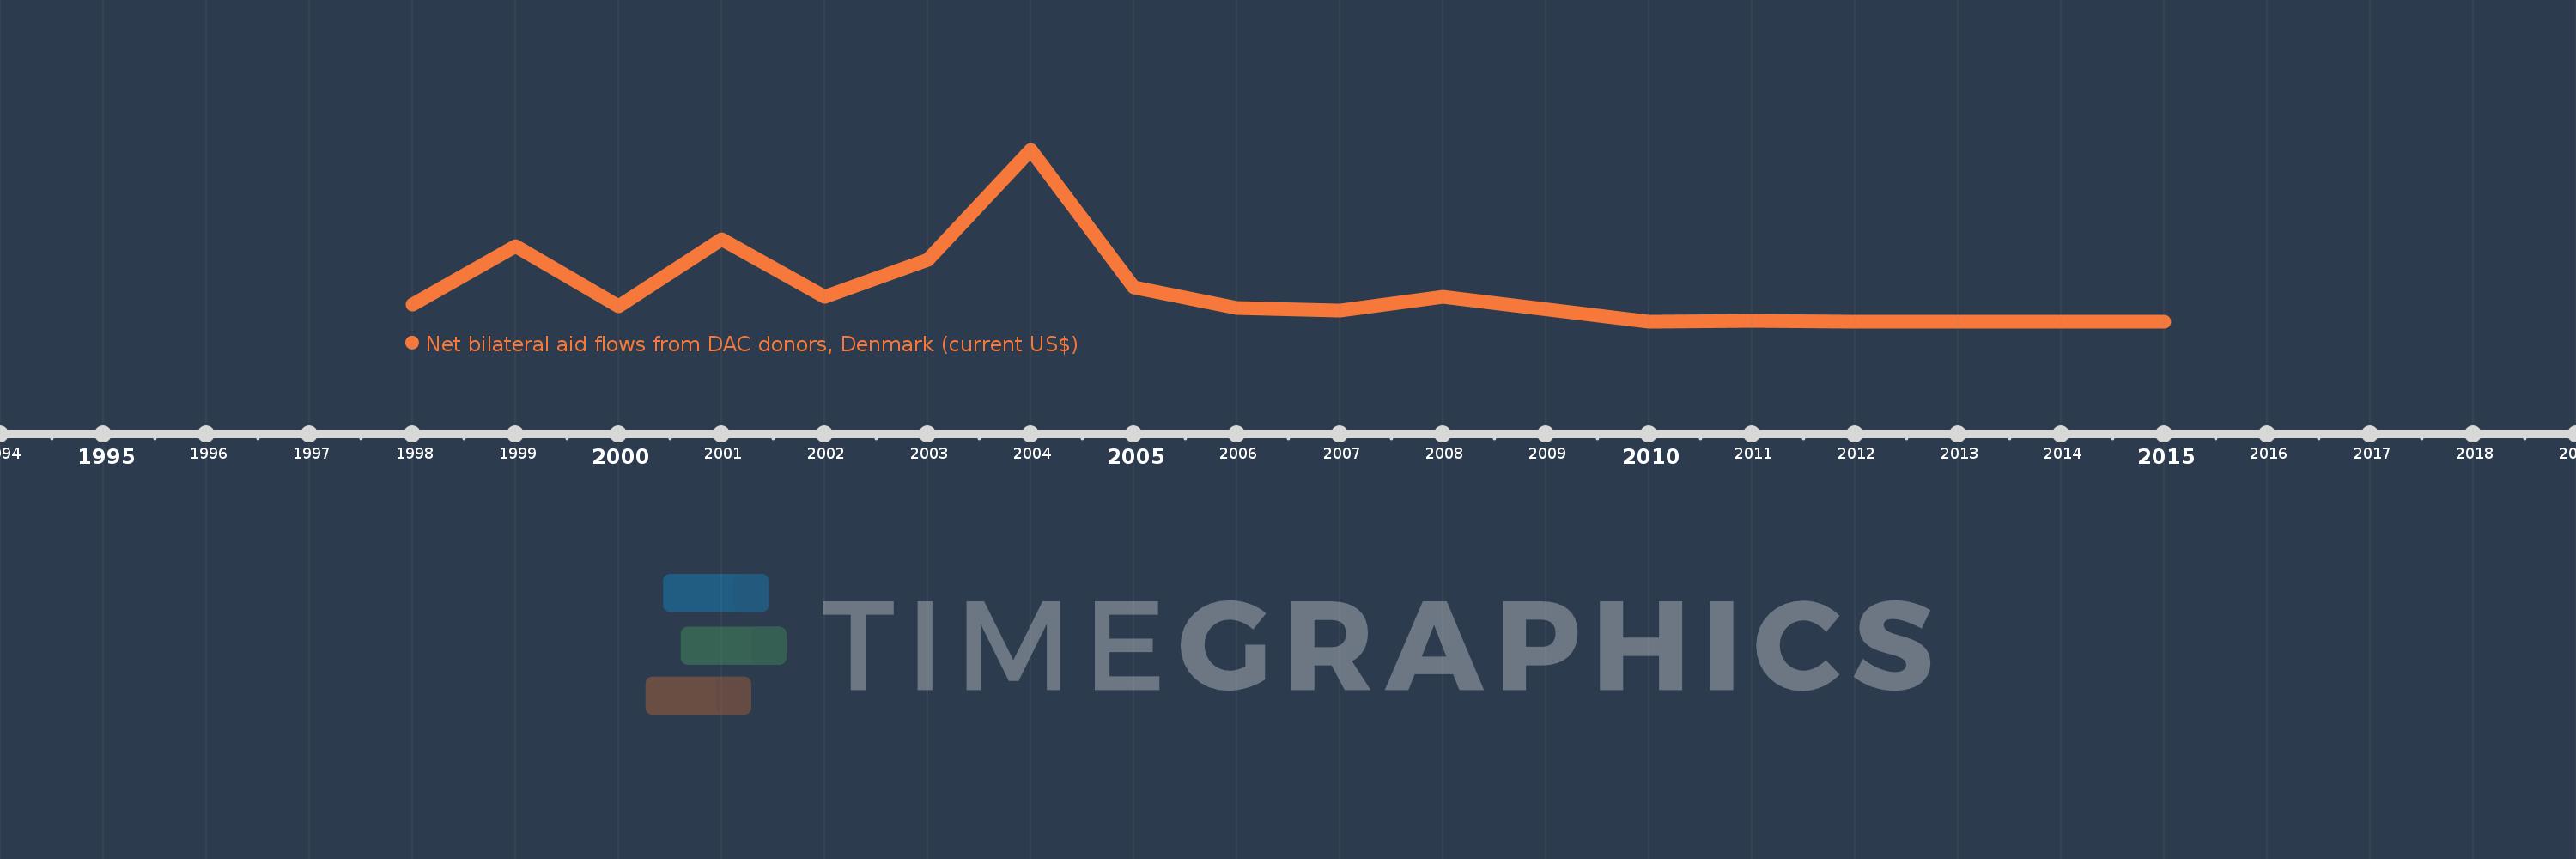
Diese Zeitleiste vorliegt die Graphik ab 1998 J. bis 2015 J. Macedonia, FYR. Die Angaben bis 1997 J. sind nicht vorhanden. Die Zahl aktueller Beobachtungen nach Daten: 17.

Die Quelle (Bezeichnung):

Kennzahlen der Weltentwicklung

Die Quelle (Einrichtung):

Development Assistance Committee of the Organisation for Economic Co-operation and Development, Geographical Distribution of Financial Flows to Developing Countries, Development Co-operation Report, and International Development Statistics database. Data are available online at: www.oecd.org/dac/stats/idsonline.

Kategorien:

Aid Effectiveness

Es wurde aktualisiert:

23 Apr 2017 Jahr

Kennzahlen der Wertänderungen vom Jahr zum Jahr

im Durchschnitt:
490.0 Tsnd.
Minimum:
10.0 Tsnd.
1 Jan 2010 Jahr
Maximum:
2.62 Mln.
1 Jan 2004 Jahr
Zum Datum der Beobachtung
Wert
Absolute Veränderung
Die Veränderung bezüglich dem vorherigen Wert
1 Jan 1998 Jahr
270.0 Tsnd.
+270.0 Tsnd.
0.0%
1 Jan 1999 Jahr
1.16 Mln.
+890.0 Tsnd.
329.63%
1 Jan 2000 Jahr
250.0 Tsnd.
-910.0 Tsnd.
-78.45%
1 Jan 2001 Jahr
1.27 Mln.
+1.02 Mln.
408.0%
1 Jan 2002 Jahr
390.0 Tsnd.
-880.0 Tsnd.
-69.29%
1 Jan 2003 Jahr
960.0 Tsnd.
+570.0 Tsnd.
146.15%
1 Jan 2004 Jahr
2.62 Mln.
+1.66 Mln.
172.92%
1 Jan 2005 Jahr
530.0 Tsnd.
-2.09 Mln.
-79.77%
1 Jan 2006 Jahr
220.0 Tsnd.
-310.0 Tsnd.
-58.49%
1 Jan 2007 Jahr
180.0 Tsnd.
-40.0 Tsnd.
-18.18%
1 Jan 2008 Jahr
390.0 Tsnd.
+210.0 Tsnd.
116.67%
1 Jan 2010 Jahr
10.0 Tsnd.
-380.0 Tsnd.
-97.44%
1 Jan 2011 Jahr
30.0 Tsnd.
+20.0 Tsnd.
200.0%
1 Jan 2012 Jahr
10.0 Tsnd.
-20.0 Tsnd.
-66.67%
1 Jan 2013 Jahr
10.0 Tsnd.
0.0
0.0%
1 Jan 2014 Jahr
10.0 Tsnd.
0.0
0.0%
1 Jan 2015 Jahr
20.0 Tsnd.
+10.0 Tsnd.
100.0%

Bewertung der Länder gemäß mit laufender Statistik nach Jahren