29
/de/
de
AIzaSyAYiBZKx7MnpbEhh9jyipgxe19OcubqV5w
April 1, 2024
287553
Zimbabwe
ZWE
true
2
1
Net bilateral aid flows from DAC donors, Portugal (current US$)
2015,2014,2013,2012,2011,2010,2009,2008,2007,2003,2002,2001,2000,1999,1998,1997,1996,1995,1993
Download
Bibliothek der Globalstatistik →Zimbabwe →

Net bilateral aid flows from DAC donors, Portugal (current US$)

Diese Statistik in anderen Ländern:
AfghanistanAlbaniaAlgeriaAngolaArab WorldArgentinaArmeniaBelarusBeninBoliviaBosnia and HerzegovinaBotswanaBrazilBulgariaBurundiCabo VerdeCambodiaCameroonCaribbean small statesCentral African RepublicCentral Europe and the BalticsChadChileChinaColombiaComorosCongo, Dem. Rep.Congo, Rep.Costa RicaCote d'IvoireCroatiaCubaCyprusCzech RepublicDominican RepublicEast Asia & PacificEast Asia & Pacific (excluding high income)East Asia & Pacific (IDA & IBRD countries)EcuadorEgypt, Arab Rep.El SalvadorEquatorial GuineaEritreaEstoniaEthiopiaEuro areaEurope & Central AsiaEurope & Central Asia (excluding high income)Europe & Central Asia (IDA & IBRD countries)European UnionFragile and conflict affected situationsGabonGambia, TheGeorgiaGhanaGuatemalaGuineaGuinea-BissauHaitiHeavily indebted poor countries (HIPC)High incomeHondurasHungaryIBRD onlyIDA & IBRD totalIDA blendIDA onlyIDA totalIndiaIndonesiaIran, Islamic Rep.IraqIsraelJamaicaJordanKazakhstanKenyaKorea, Dem. People’s Rep.Korea, Rep.KosovoKyrgyz RepublicLao PDRLatin America & Caribbean Latin America & Caribbean (excluding high income)Latin America & the Caribbean (IDA & IBRD countries)LatviaLeast developed countries: UN classificationLebanonLiberiaLibyaLow & middle incomeLow incomeLower middle incomeMacao SAR, ChinaMacedonia, FYRMadagascarMalawiMalaysiaMaldivesMaliMauritaniaMexicoMiddle East & North AfricaMiddle East & North Africa (excluding high income)Middle East & North Africa (IDA & IBRD countries)Middle incomeMoldovaMontenegroMoroccoMozambiqueMyanmarNamibiaNepalNicaraguaNigerNigeriaOECD membersOther small statesPacific island small statesPakistanPanamaParaguayPeruPhilippinesPolandRomaniaRussian FederationRwandaSao Tome and PrincipeSenegalSerbiaSeychellesSierra LeoneSlovak RepublicSloveniaSmall statesSolomon IslandsSomaliaSouth AfricaSouth AsiaSouth Asia (IDA & IBRD)Sri LankaSt. LuciaSt. Vincent and the GrenadinesSub-Saharan Africa Sub-Saharan Africa (excluding high income)Sub-Saharan Africa (IDA & IBRD countries)SudanSurinameSwazilandSyrian Arab RepublicTajikistanTanzaniaThailandTimor-LesteTogoTunisiaTurkeyUkraineUpper middle incomeUruguayVenezuela, RBVietnamWest Bank and GazaWorldZambiaZimbabwe
Zeitlinie:
Diese Zeitleiste vorliegt die Graphik ab 1993 J. bis 2015 J. Zimbabwe. Die Angaben bis 1992 J. sind nicht vorhanden. Die Zahl aktueller Beobachtungen nach Daten: 19.
Die Quelle (Bezeichnung):
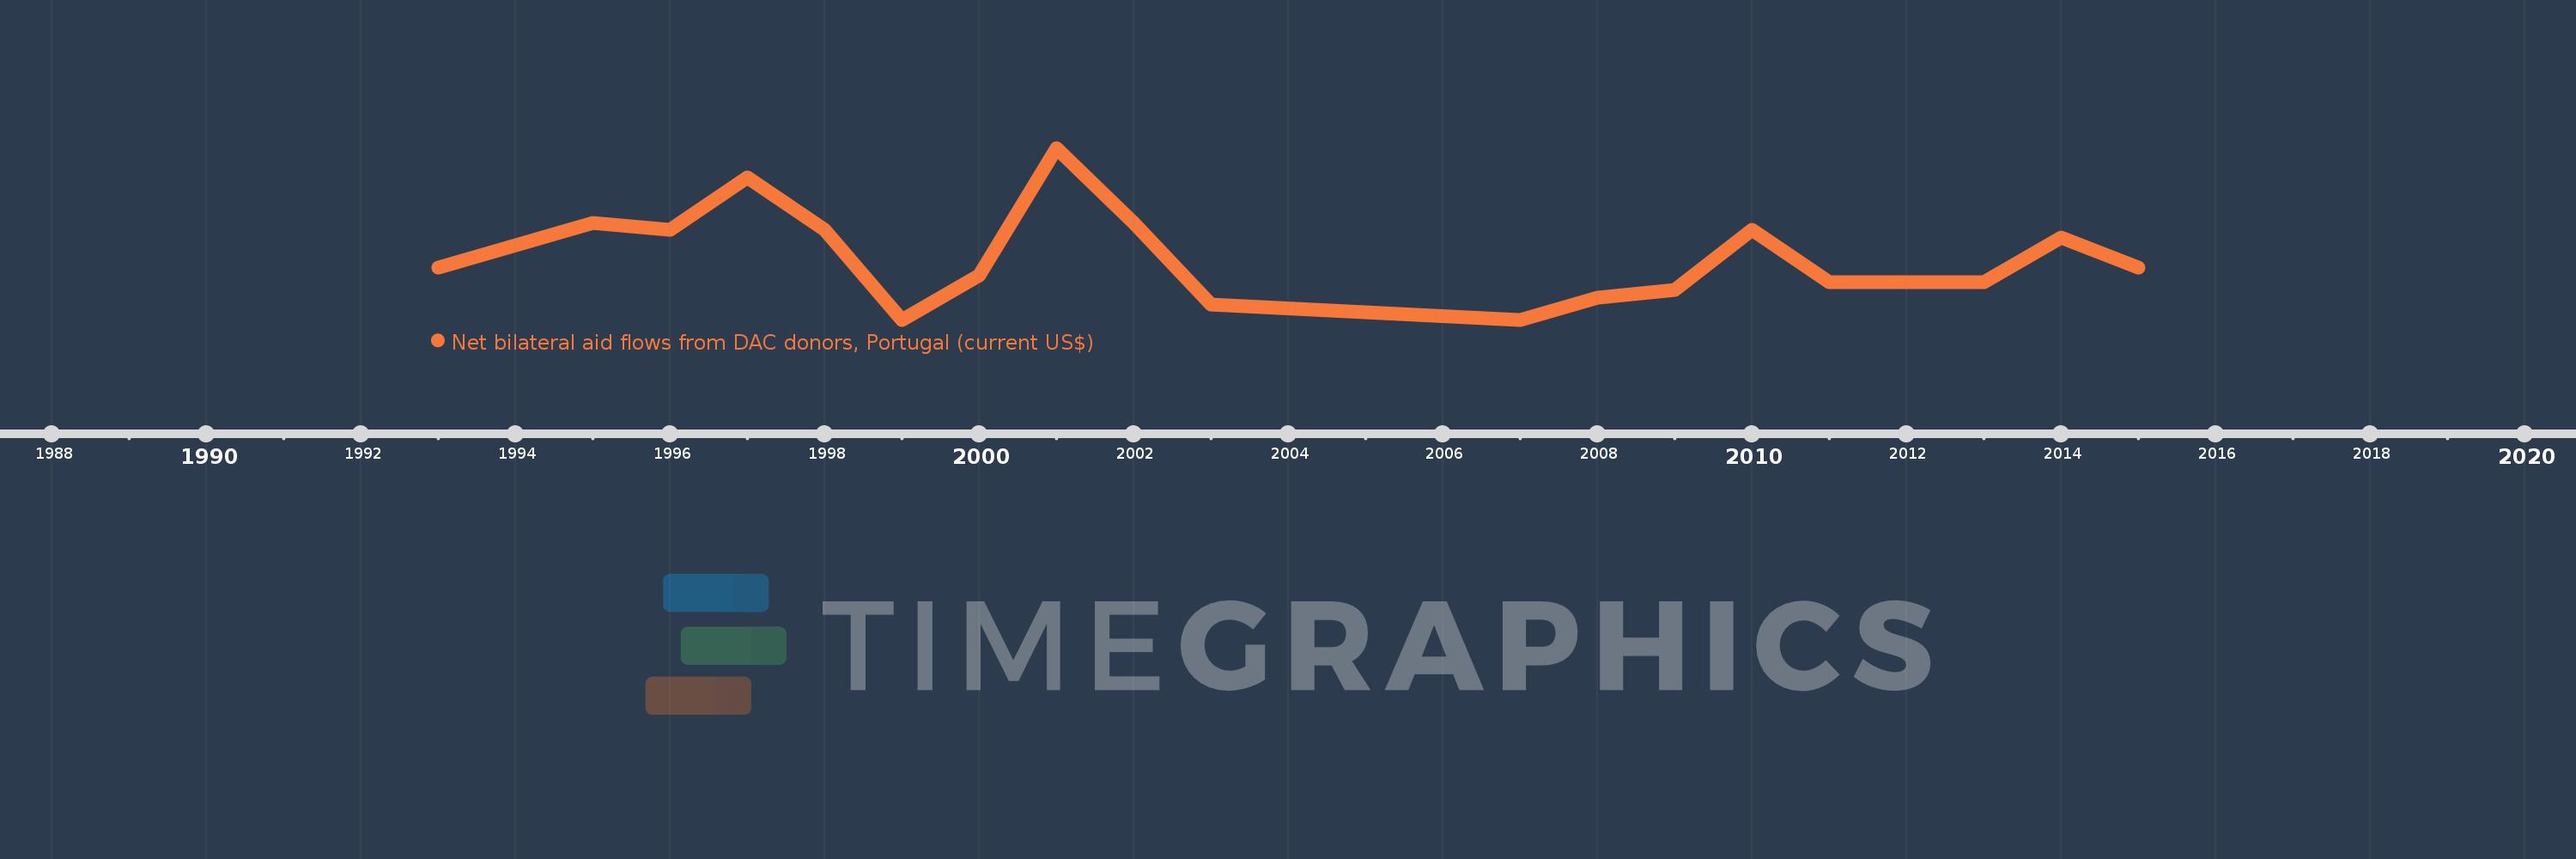
Kennzahlen der Weltentwicklung
Die Quelle (Einrichtung):
Development Assistance Committee of the Organisation for Economic Co-operation and Development, Geographical Distribution of Financial Flows to Developing Countries, Development Co-operation Report, and International Development Statistics database. Data are available online at: www.oecd.org/dac/stats/idsonline.
Kategorien:
Aid Effectiveness
Es wurde aktualisiert:
23 Apr 2017 Jahr
Kennzahlen der Wertänderungen vom Jahr zum Jahr
im Durchschnitt:
93.684 Tsnd.
Minimum:
10.0 Tsnd.
1 Jan 1999 Jahr
Maximum:
240.0 Tsnd.
1 Jan 2001 Jahr
Zum Datum der Beobachtung
Wert
Absolute Veränderung
Die Veränderung bezüglich dem vorherigen Wert
1 Jan 1993 Jahr
80.0 Tsnd.
+80.0 Tsnd.
0.0%
1 Jan 1995 Jahr
140.0 Tsnd.
+60.0 Tsnd.
75.0%
1 Jan 1996 Jahr
130.0 Tsnd.
-10.0 Tsnd.
-7.14%
1 Jan 1997 Jahr
200.0 Tsnd.
+70.0 Tsnd.
53.85%
1 Jan 1998 Jahr
130.0 Tsnd.
-70.0 Tsnd.
-35.0%
1 Jan 1999 Jahr
10.0 Tsnd.
-120.0 Tsnd.
-92.31%
1 Jan 2000 Jahr
70.0 Tsnd.
+60.0 Tsnd.
600.0%
1 Jan 2001 Jahr
240.0 Tsnd.
+170.0 Tsnd.
242.86%
1 Jan 2002 Jahr
140.0 Tsnd.
-100.0 Tsnd.
-41.67%
1 Jan 2003 Jahr
30.0 Tsnd.
-110.0 Tsnd.
-78.57%
1 Jan 2007 Jahr
10.0 Tsnd.
-20.0 Tsnd.
-66.67%
1 Jan 2008 Jahr
40.0 Tsnd.
+30.0 Tsnd.
300.0%
1 Jan 2009 Jahr
50.0 Tsnd.
+10.0 Tsnd.
25.0%
1 Jan 2010 Jahr
130.0 Tsnd.
+80.0 Tsnd.
160.0%
1 Jan 2011 Jahr
60.0 Tsnd.
-70.0 Tsnd.
-53.85%
1 Jan 2012 Jahr
60.0 Tsnd.
0.0
0.0%
1 Jan 2013 Jahr
60.0 Tsnd.
0.0
0.0%
1 Jan 2014 Jahr
120.0 Tsnd.
+60.0 Tsnd.
100.0%
1 Jan 2015 Jahr
80.0 Tsnd.
-40.0 Tsnd.
-33.33%
Bewertung der Länder gemäß mit laufender Statistik nach Jahren

Kommentare:

Abschicken
PremiumAbout & FeedbackVereinbarungPrivatheit
logo
© 2022 Selected Technologies LLC – Morgan Hill, California