33
/de/
AIzaSyAYiBZKx7MnpbEhh9jyipgxe19OcubqV5w
August 1, 2025
231388
Rwanda
RWA
true
2
1
Net bilateral aid flows from DAC donors, Portugal (current US$)
2015,2014,2013,2012,2011,2010,2009,2008,2007,2006,2005,2004,1998,1997,1995
Download
Bibliothek der Globalstatistik →Rwanda →

Net bilateral aid flows from DAC donors, Portugal (current US$)

Diese Statistik in anderen Ländern:

AfghanistanAlbaniaAlgeriaAngolaArab WorldArgentinaArmeniaBelarusBeninBoliviaBosnia and HerzegovinaBotswanaBrazilBulgariaBurundiCabo VerdeCambodiaCameroonCaribbean small statesCentral African RepublicCentral Europe and the BalticsChadChileChinaColombiaComorosCongo, Dem. Rep.Congo, Rep.Costa RicaCote d'IvoireCroatiaCubaCyprusCzech RepublicDominican RepublicEast Asia & PacificEast Asia & Pacific (excluding high income)East Asia & Pacific (IDA & IBRD countries)EcuadorEgypt, Arab Rep.El SalvadorEquatorial GuineaEritreaEstoniaEthiopiaEuro areaEurope & Central AsiaEurope & Central Asia (excluding high income)Europe & Central Asia (IDA & IBRD countries)European UnionFragile and conflict affected situationsGabonGambia, TheGeorgiaGhanaGuatemalaGuineaGuinea-BissauHaitiHeavily indebted poor countries (HIPC)High incomeHondurasHungaryIBRD onlyIDA & IBRD totalIDA blendIDA onlyIDA totalIndiaIndonesiaIran, Islamic Rep.IraqIsraelJamaicaJordanKazakhstanKenyaKorea, Dem. People’s Rep.Korea, Rep.KosovoKyrgyz RepublicLao PDRLatin America & Caribbean Latin America & Caribbean (excluding high income)Latin America & the Caribbean (IDA & IBRD countries)LatviaLeast developed countries: UN classificationLebanonLiberiaLibyaLow & middle incomeLow incomeLower middle incomeMacao SAR, ChinaMacedonia, FYRMadagascarMalawiMalaysiaMaldivesMaliMauritaniaMexicoMiddle East & North AfricaMiddle East & North Africa (excluding high income)Middle East & North Africa (IDA & IBRD countries)Middle incomeMoldovaMontenegroMoroccoMozambiqueMyanmarNamibiaNepalNicaraguaNigerNigeriaOECD membersOther small statesPacific island small statesPakistanPanamaParaguayPeruPhilippinesPolandRomaniaRussian FederationRwandaSao Tome and PrincipeSenegalSerbiaSeychellesSierra LeoneSlovak RepublicSloveniaSmall statesSolomon IslandsSomaliaSouth AfricaSouth AsiaSouth Asia (IDA & IBRD)Sri LankaSt. LuciaSt. Vincent and the GrenadinesSub-Saharan Africa Sub-Saharan Africa (excluding high income)Sub-Saharan Africa (IDA & IBRD countries)SudanSurinameSwazilandSyrian Arab RepublicTajikistanTanzaniaThailandTimor-LesteTogoTunisiaTurkeyUkraineUpper middle incomeUruguayVenezuela, RBVietnamWest Bank and GazaWorldZambiaZimbabwe

Zeitlinie:

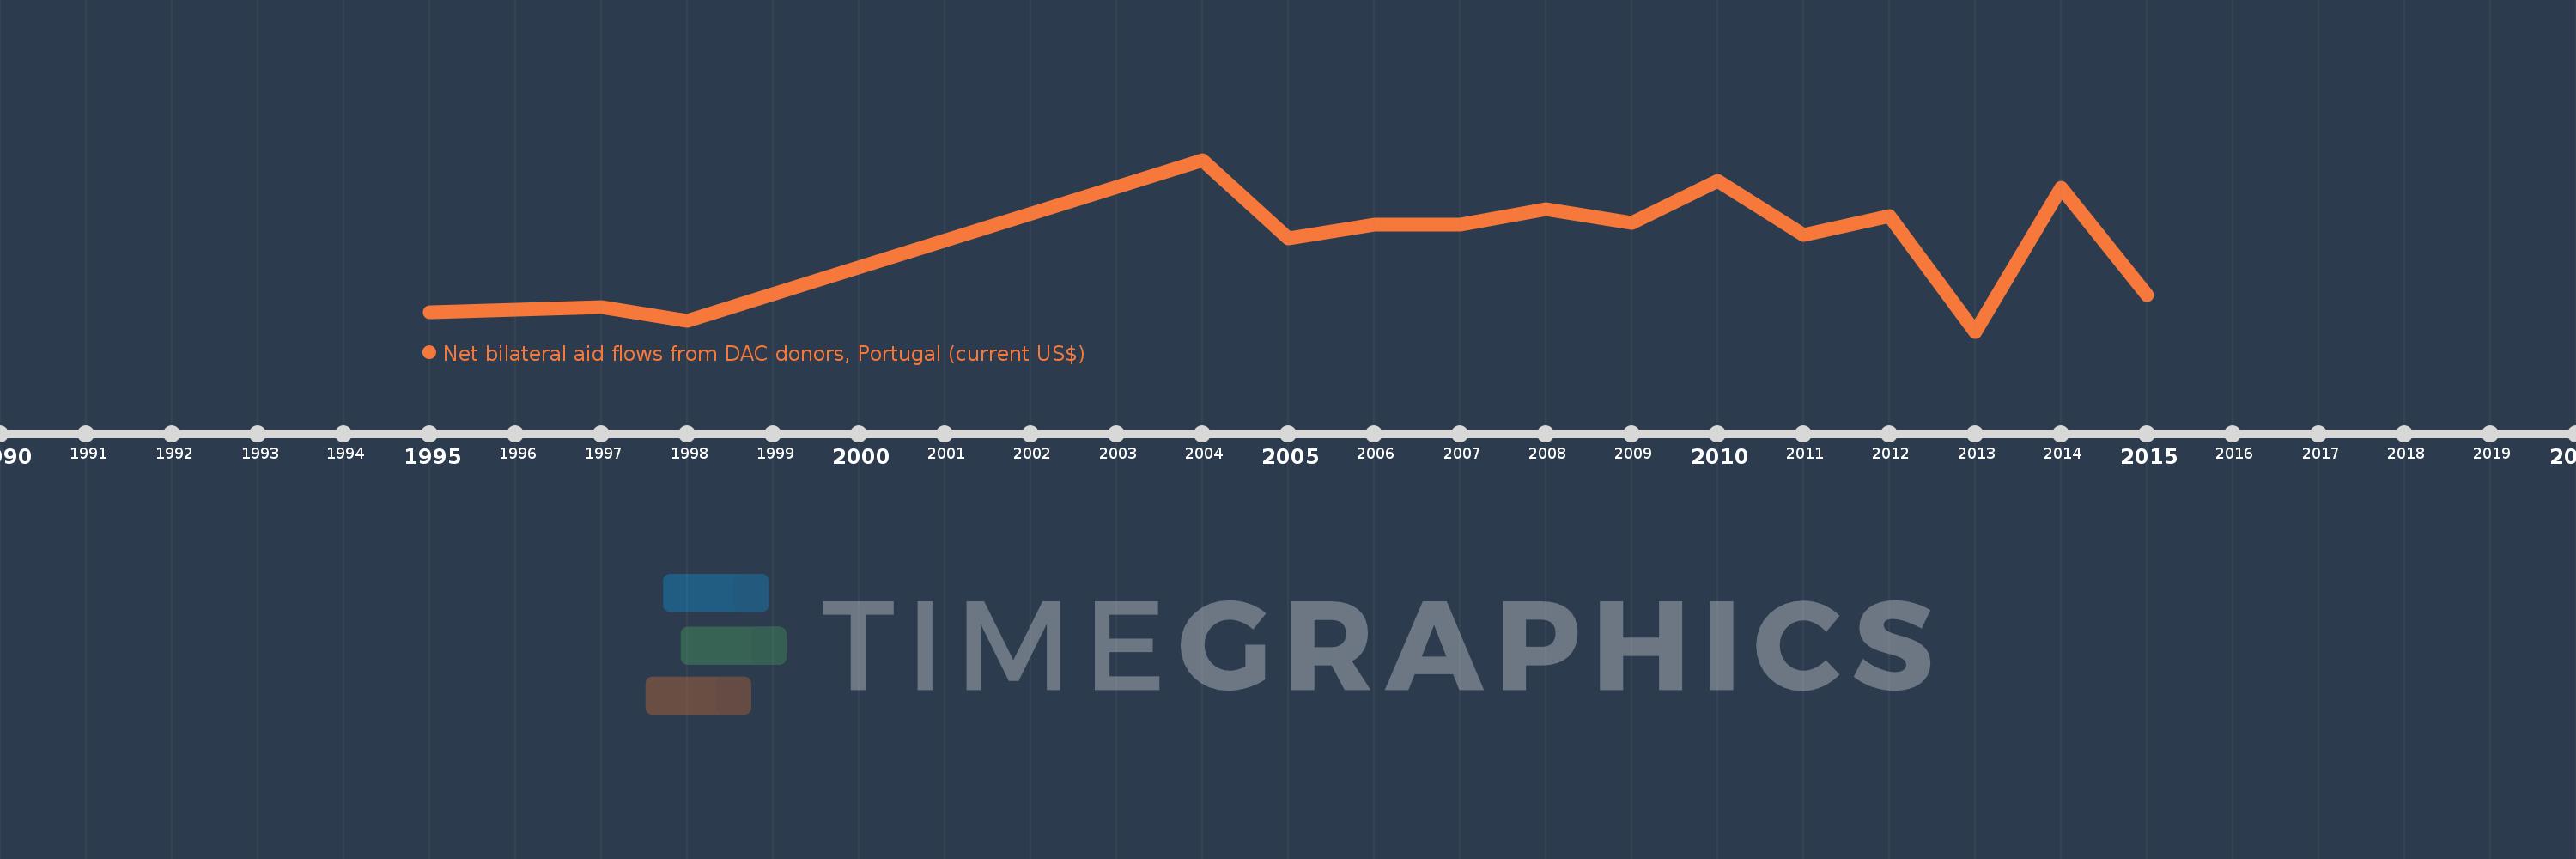
Diese Zeitleiste vorliegt die Graphik ab 1995 J. bis 2015 J. Rwanda. Die Angaben bis 1994 J. sind nicht vorhanden. Die Zahl aktueller Beobachtungen nach Daten: 15.

Die Quelle (Bezeichnung):

Kennzahlen der Weltentwicklung

Die Quelle (Einrichtung):

Development Assistance Committee of the Organisation for Economic Co-operation and Development, Geographical Distribution of Financial Flows to Developing Countries, Development Co-operation Report, and International Development Statistics database. Data are available online at: www.oecd.org/dac/stats/idsonline.

Kategorien:

Aid Effectiveness

Es wurde aktualisiert:

23 Apr 2017 Jahr

Kennzahlen der Wertänderungen vom Jahr zum Jahr

im Durchschnitt:
497.333 Tsnd.
Minimum:
0.0
1 Jan 2013 Jahr
Maximum:
980.0 Tsnd.
1 Jan 2004 Jahr
Zum Datum der Beobachtung
Wert
Absolute Veränderung
Die Veränderung bezüglich dem vorherigen Wert
1 Jan 1995 Jahr
110.0 Tsnd.
+110.0 Tsnd.
0.0%
1 Jan 1997 Jahr
140.0 Tsnd.
+30.0 Tsnd.
27.27%
1 Jan 1998 Jahr
60.0 Tsnd.
-80.0 Tsnd.
-57.14%
1 Jan 2004 Jahr
980.0 Tsnd.
+920.0 Tsnd.
1.53 Tsnd.%
1 Jan 2005 Jahr
530.0 Tsnd.
-450.0 Tsnd.
-45.92%
1 Jan 2006 Jahr
610.0 Tsnd.
+80.0 Tsnd.
15.09%
1 Jan 2007 Jahr
610.0 Tsnd.
0.0
0.0%
1 Jan 2008 Jahr
700.0 Tsnd.
+90.0 Tsnd.
14.75%
1 Jan 2009 Jahr
620.0 Tsnd.
-80.0 Tsnd.
-11.43%
1 Jan 2010 Jahr
860.0 Tsnd.
+240.0 Tsnd.
38.71%
1 Jan 2011 Jahr
550.0 Tsnd.
-310.0 Tsnd.
-36.05%
1 Jan 2012 Jahr
660.0 Tsnd.
+110.0 Tsnd.
20.0%
1 Jan 2013 Jahr
0.0
-660.0 Tsnd.
-100.0%
1 Jan 2014 Jahr
820.0 Tsnd.
+820.0 Tsnd.
%
1 Jan 2015 Jahr
210.0 Tsnd.
-610.0 Tsnd.
-74.39%

Bewertung der Länder gemäß mit laufender Statistik nach Jahren