33
/de/
AIzaSyAYiBZKx7MnpbEhh9jyipgxe19OcubqV5w
August 1, 2025
154967
India
IND
true
2
1
Net bilateral aid flows from DAC donors, Portugal (current US$)
2015,2014,2013,2012,2011,2010,2009,2008,2007,2006,2005,2003,2002,2001,2000,1995,1962,1961
Download
Bibliothek der Globalstatistik →India →

Net bilateral aid flows from DAC donors, Portugal (current US$)

Diese Statistik in anderen Ländern:

AfghanistanAlbaniaAlgeriaAngolaArab WorldArgentinaArmeniaBelarusBeninBoliviaBosnia and HerzegovinaBotswanaBrazilBulgariaBurundiCabo VerdeCambodiaCameroonCaribbean small statesCentral African RepublicCentral Europe and the BalticsChadChileChinaColombiaComorosCongo, Dem. Rep.Congo, Rep.Costa RicaCote d'IvoireCroatiaCubaCyprusCzech RepublicDominican RepublicEast Asia & PacificEast Asia & Pacific (excluding high income)East Asia & Pacific (IDA & IBRD countries)EcuadorEgypt, Arab Rep.El SalvadorEquatorial GuineaEritreaEstoniaEthiopiaEuro areaEurope & Central AsiaEurope & Central Asia (excluding high income)Europe & Central Asia (IDA & IBRD countries)European UnionFragile and conflict affected situationsGabonGambia, TheGeorgiaGhanaGuatemalaGuineaGuinea-BissauHaitiHeavily indebted poor countries (HIPC)High incomeHondurasHungaryIBRD onlyIDA & IBRD totalIDA blendIDA onlyIDA totalIndiaIndonesiaIran, Islamic Rep.IraqIsraelJamaicaJordanKazakhstanKenyaKorea, Dem. People’s Rep.Korea, Rep.KosovoKyrgyz RepublicLao PDRLatin America & Caribbean Latin America & Caribbean (excluding high income)Latin America & the Caribbean (IDA & IBRD countries)LatviaLeast developed countries: UN classificationLebanonLiberiaLibyaLow & middle incomeLow incomeLower middle incomeMacao SAR, ChinaMacedonia, FYRMadagascarMalawiMalaysiaMaldivesMaliMauritaniaMexicoMiddle East & North AfricaMiddle East & North Africa (excluding high income)Middle East & North Africa (IDA & IBRD countries)Middle incomeMoldovaMontenegroMoroccoMozambiqueMyanmarNamibiaNepalNicaraguaNigerNigeriaOECD membersOther small statesPacific island small statesPakistanPanamaParaguayPeruPhilippinesPolandRomaniaRussian FederationRwandaSao Tome and PrincipeSenegalSerbiaSeychellesSierra LeoneSlovak RepublicSloveniaSmall statesSolomon IslandsSomaliaSouth AfricaSouth AsiaSouth Asia (IDA & IBRD)Sri LankaSt. LuciaSt. Vincent and the GrenadinesSub-Saharan Africa Sub-Saharan Africa (excluding high income)Sub-Saharan Africa (IDA & IBRD countries)SudanSurinameSwazilandSyrian Arab RepublicTajikistanTanzaniaThailandTimor-LesteTogoTunisiaTurkeyUkraineUpper middle incomeUruguayVenezuela, RBVietnamWest Bank and GazaWorldZambiaZimbabwe

Zeitlinie:

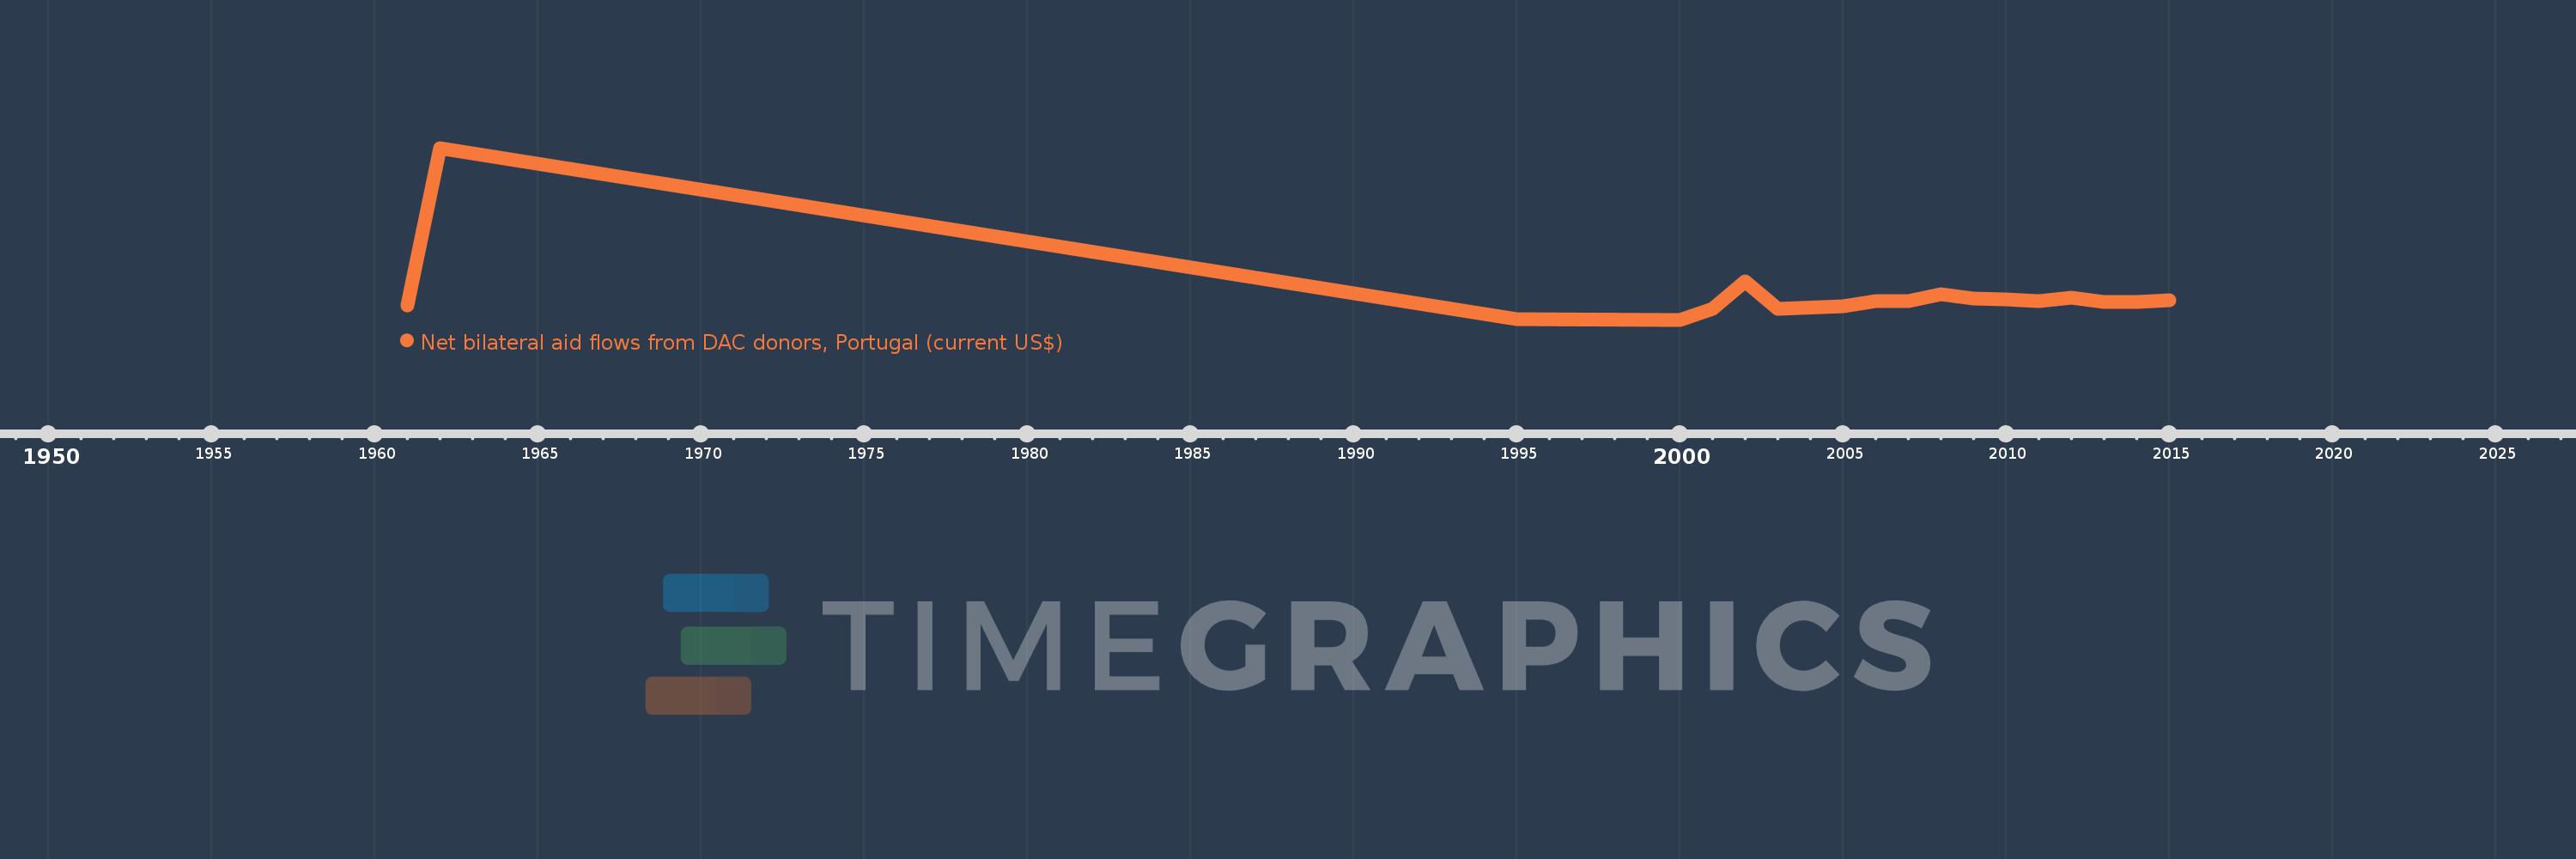
Diese Zeitleiste vorliegt die Graphik ab 1961 J. bis 2015 J. India. Die Angaben bis 1960 J. sind nicht vorhanden. Die Zahl aktueller Beobachtungen nach Daten: 18.

Die Quelle (Bezeichnung):

Kennzahlen der Weltentwicklung

Die Quelle (Einrichtung):

Development Assistance Committee of the Organisation for Economic Co-operation and Development, Geographical Distribution of Financial Flows to Developing Countries, Development Co-operation Report, and International Development Statistics database. Data are available online at: www.oecd.org/dac/stats/idsonline.

Kategorien:

Aid Effectiveness

Es wurde aktualisiert:

23 Apr 2017 Jahr

Kennzahlen der Wertänderungen vom Jahr zum Jahr

im Durchschnitt:
525.0 Tsnd.
Minimum:
30.0 Tsnd.
1 Jan 2000 Jahr
Maximum:
3.36 Mln.
1 Jan 1962 Jahr
Zum Datum der Beobachtung
Wert
Absolute Veränderung
Die Veränderung bezüglich dem vorherigen Wert
1 Jan 1961 Jahr
300.0 Tsnd.
+300.0 Tsnd.
0.0%
1 Jan 1962 Jahr
3.36 Mln.
+3.06 Mln.
1.02 Tsnd.%
1 Jan 1995 Jahr
40.0 Tsnd.
-3.32 Mln.
-98.81%
1 Jan 2000 Jahr
30.0 Tsnd.
-10.0 Tsnd.
-25.0%
1 Jan 2001 Jahr
240.0 Tsnd.
+210.0 Tsnd.
700.0%
1 Jan 2002 Jahr
780.0 Tsnd.
+540.0 Tsnd.
225.0%
1 Jan 2003 Jahr
240.0 Tsnd.
-540.0 Tsnd.
-69.23%
1 Jan 2005 Jahr
290.0 Tsnd.
+50.0 Tsnd.
20.83%
1 Jan 2006 Jahr
390.0 Tsnd.
+100.0 Tsnd.
34.48%
1 Jan 2007 Jahr
390.0 Tsnd.
0.0
0.0%
1 Jan 2008 Jahr
520.0 Tsnd.
+130.0 Tsnd.
33.33%
1 Jan 2009 Jahr
440.0 Tsnd.
-80.0 Tsnd.
-15.38%
1 Jan 2010 Jahr
420.0 Tsnd.
-20.0 Tsnd.
-4.55%
1 Jan 2011 Jahr
390.0 Tsnd.
-30.0 Tsnd.
-7.14%
1 Jan 2012 Jahr
460.0 Tsnd.
+70.0 Tsnd.
17.95%
1 Jan 2013 Jahr
380.0 Tsnd.
-80.0 Tsnd.
-17.39%
1 Jan 2014 Jahr
380.0 Tsnd.
0.0
0.0%
1 Jan 2015 Jahr
400.0 Tsnd.
+20.0 Tsnd.
5.26%

Bewertung der Länder gemäß mit laufender Statistik nach Jahren