30
/de/
AIzaSyAYiBZKx7MnpbEhh9jyipgxe19OcubqV5w
April 1, 2024
110005
Congo, Dem. Rep.
COD
true
2
1
Net bilateral aid flows from DAC donors, Portugal (current US$)
2015,2014,2013,2012,2011,2010,2009,2008,2007,2006,2005,2004,2003,2000,1998,1996,1992
Download
Bibliothek der Globalstatistik →Congo, Dem. Rep. →

Net bilateral aid flows from DAC donors, Portugal (current US$)

Diese Statistik in anderen Ländern:

AfghanistanAlbaniaAlgeriaAngolaArab WorldArgentinaArmeniaBelarusBeninBoliviaBosnia and HerzegovinaBotswanaBrazilBulgariaBurundiCabo VerdeCambodiaCameroonCaribbean small statesCentral African RepublicCentral Europe and the BalticsChadChileChinaColombiaComorosCongo, Dem. Rep.Congo, Rep.Costa RicaCote d'IvoireCroatiaCubaCyprusCzech RepublicDominican RepublicEast Asia & PacificEast Asia & Pacific (excluding high income)East Asia & Pacific (IDA & IBRD countries)EcuadorEgypt, Arab Rep.El SalvadorEquatorial GuineaEritreaEstoniaEthiopiaEuro areaEurope & Central AsiaEurope & Central Asia (excluding high income)Europe & Central Asia (IDA & IBRD countries)European UnionFragile and conflict affected situationsGabonGambia, TheGeorgiaGhanaGuatemalaGuineaGuinea-BissauHaitiHeavily indebted poor countries (HIPC)High incomeHondurasHungaryIBRD onlyIDA & IBRD totalIDA blendIDA onlyIDA totalIndiaIndonesiaIran, Islamic Rep.IraqIsraelJamaicaJordanKazakhstanKenyaKorea, Dem. People’s Rep.Korea, Rep.KosovoKyrgyz RepublicLao PDRLatin America & Caribbean Latin America & Caribbean (excluding high income)Latin America & the Caribbean (IDA & IBRD countries)LatviaLeast developed countries: UN classificationLebanonLiberiaLibyaLow & middle incomeLow incomeLower middle incomeMacao SAR, ChinaMacedonia, FYRMadagascarMalawiMalaysiaMaldivesMaliMauritaniaMexicoMiddle East & North AfricaMiddle East & North Africa (excluding high income)Middle East & North Africa (IDA & IBRD countries)Middle incomeMoldovaMontenegroMoroccoMozambiqueMyanmarNamibiaNepalNicaraguaNigerNigeriaOECD membersOther small statesPacific island small statesPakistanPanamaParaguayPeruPhilippinesPolandRomaniaRussian FederationRwandaSao Tome and PrincipeSenegalSerbiaSeychellesSierra LeoneSlovak RepublicSloveniaSmall statesSolomon IslandsSomaliaSouth AfricaSouth AsiaSouth Asia (IDA & IBRD)Sri LankaSt. LuciaSt. Vincent and the GrenadinesSub-Saharan Africa Sub-Saharan Africa (excluding high income)Sub-Saharan Africa (IDA & IBRD countries)SudanSurinameSwazilandSyrian Arab RepublicTajikistanTanzaniaThailandTimor-LesteTogoTunisiaTurkeyUkraineUpper middle incomeUruguayVenezuela, RBVietnamWest Bank and GazaWorldZambiaZimbabwe

Zeitlinie:

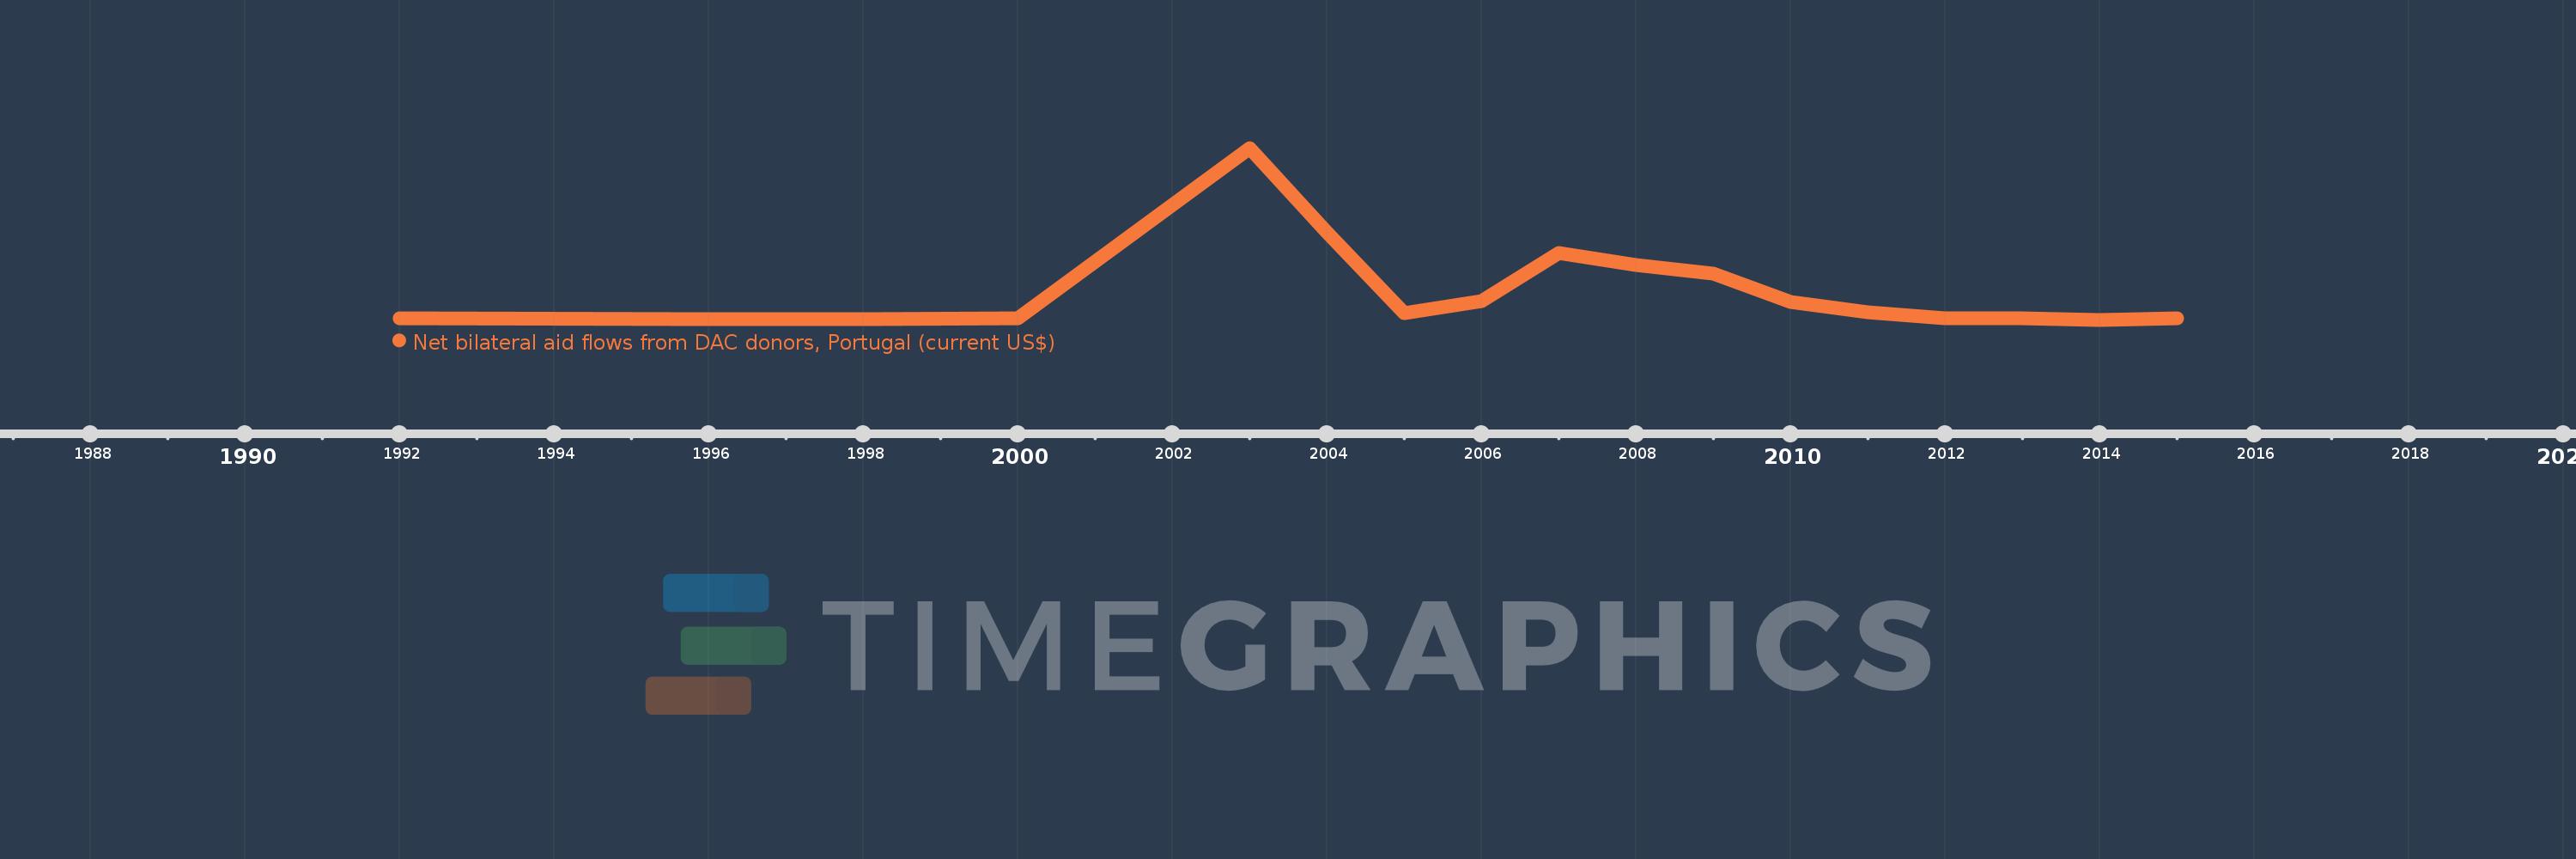
Diese Zeitleiste vorliegt die Graphik ab 1992 J. bis 2015 J. Congo, Dem. Rep.. Die Angaben bis 1991 J. sind nicht vorhanden. Die Zahl aktueller Beobachtungen nach Daten: 17.

Die Quelle (Bezeichnung):

Kennzahlen der Weltentwicklung

Die Quelle (Einrichtung):

Development Assistance Committee of the Organisation for Economic Co-operation and Development, Geographical Distribution of Financial Flows to Developing Countries, Development Co-operation Report, and International Development Statistics database. Data are available online at: www.oecd.org/dac/stats/idsonline.

Kategorien:

Aid Effectiveness

Es wurde aktualisiert:

23 Apr 2017 Jahr

Kennzahlen der Wertänderungen vom Jahr zum Jahr

im Durchschnitt:
778.824 Tsnd.
Minimum:
0.0
1 Jan 2014 Jahr
Maximum:
4.7 Mln.
1 Jan 2003 Jahr
Zum Datum der Beobachtung
Wert
Absolute Veränderung
Die Veränderung bezüglich dem vorherigen Wert
1 Jan 1992 Jahr
40.0 Tsnd.
+40.0 Tsnd.
0.0%
1 Jan 1996 Jahr
20.0 Tsnd.
-20.0 Tsnd.
-50.0%
1 Jan 1998 Jahr
10.0 Tsnd.
-10.0 Tsnd.
-50.0%
1 Jan 2000 Jahr
30.0 Tsnd.
+20.0 Tsnd.
200.0%
1 Jan 2003 Jahr
4.7 Mln.
+4.67 Mln.
15.57 Tsnd.%
1 Jan 2004 Jahr
2.4 Mln.
-2.3 Mln.
-48.94%
1 Jan 2005 Jahr
170.0 Tsnd.
-2.23 Mln.
-92.92%
1 Jan 2006 Jahr
510.0 Tsnd.
+340.0 Tsnd.
200.0%
1 Jan 2007 Jahr
1.82 Mln.
+1.31 Mln.
256.86%
1 Jan 2008 Jahr
1.49 Mln.
-330.0 Tsnd.
-18.13%
1 Jan 2009 Jahr
1.26 Mln.
-230.0 Tsnd.
-15.44%
1 Jan 2010 Jahr
480.0 Tsnd.
-780.0 Tsnd.
-61.9%
1 Jan 2011 Jahr
210.0 Tsnd.
-270.0 Tsnd.
-56.25%
1 Jan 2012 Jahr
30.0 Tsnd.
-180.0 Tsnd.
-85.71%
1 Jan 2013 Jahr
40.0 Tsnd.
+10.0 Tsnd.
33.33%
1 Jan 2014 Jahr
0.0
-40.0 Tsnd.
-100.0%
1 Jan 2015 Jahr
30.0 Tsnd.
+30.0 Tsnd.
%

Bewertung der Länder gemäß mit laufender Statistik nach Jahren