30
/de/
AIzaSyAYiBZKx7MnpbEhh9jyipgxe19OcubqV5w
April 1, 2024
262672
Thailand
THA
true
2
1
Net official flows from UN agencies, WFP (current US$)
2015,2014,2013,2012,2001,1999,1998,1996,1995,1994,1993,1992,1991,1981,1980,1979,1977
Download
Bibliothek der Globalstatistik →Thailand →

Net official flows from UN agencies, WFP (current US$)

Diese Statistik in anderen Ländern:

AfghanistanAlbaniaAlgeriaAngolaAntigua and BarbudaArab WorldArgentinaArmeniaAzerbaijanBangladeshBarbadosBelizeBeninBhutanBoliviaBosnia and HerzegovinaBotswanaBrazilBulgariaBurkina FasoBurundiCabo VerdeCambodiaCameroonCaribbean small statesCentral African RepublicCentral Europe and the BalticsChadChileChinaColombiaComorosCongo, Dem. Rep.Congo, Rep.Costa RicaCote d'IvoireCubaCyprusDjiboutiDominicaDominican RepublicEast Asia & PacificEast Asia & Pacific (excluding high income)East Asia & Pacific (IDA & IBRD countries)EcuadorEgypt, Arab Rep.El SalvadorEquatorial GuineaEritreaEstoniaEthiopiaEuro areaEurope & Central AsiaEurope & Central Asia (excluding high income)Europe & Central Asia (IDA & IBRD countries)European UnionFijiFragile and conflict affected situationsGabonGambia, TheGeorgiaGhanaGrenadaGuatemalaGuineaGuinea-BissauGuyanaHaitiHeavily indebted poor countries (HIPC)High incomeHondurasIBRD onlyIDA & IBRD totalIDA blendIDA onlyIDA totalIndiaIndonesiaIran, Islamic Rep.IraqJamaicaJordanKenyaKorea, Dem. People’s Rep.Korea, Rep.KuwaitKyrgyz RepublicLao PDRLatin America & Caribbean Latin America & Caribbean (excluding high income)Latin America & the Caribbean (IDA & IBRD countries)Least developed countries: UN classificationLebanonLesothoLiberiaLibyaLow & middle incomeLow incomeLower middle incomeMacedonia, FYRMadagascarMalawiMalaysiaMaldivesMaliMaltaMauritaniaMauritiusMexicoMiddle East & North AfricaMiddle East & North Africa (excluding high income)Middle East & North Africa (IDA & IBRD countries)Middle incomeMoldovaMongoliaMoroccoMozambiqueMyanmarNamibiaNepalNicaraguaNigerNigeriaOECD membersOmanOther small statesPacific island small statesPakistanPanamaPapua New GuineaParaguayPeruPhilippinesPolandRomaniaRussian FederationRwandaSamoaSao Tome and PrincipeSenegalSerbiaSeychellesSierra LeoneSingaporeSmall statesSolomon IslandsSomaliaSouth AfricaSouth AsiaSouth Asia (IDA & IBRD)South SudanSri LankaSt. Kitts and NevisSt. LuciaSt. Vincent and the GrenadinesSub-Saharan Africa Sub-Saharan Africa (excluding high income)Sub-Saharan Africa (IDA & IBRD countries)SudanSurinameSwazilandSyrian Arab RepublicTajikistanTanzaniaThailandTimor-LesteTogoTongaTrinidad and TobagoTunisiaTurkeyTurkmenistanUgandaUnited Arab EmiratesUpper middle incomeUruguayVanuatuVenezuela, RBVietnamWest Bank and GazaWorldYemen, Rep.ZambiaZimbabwe

Zeitlinie:

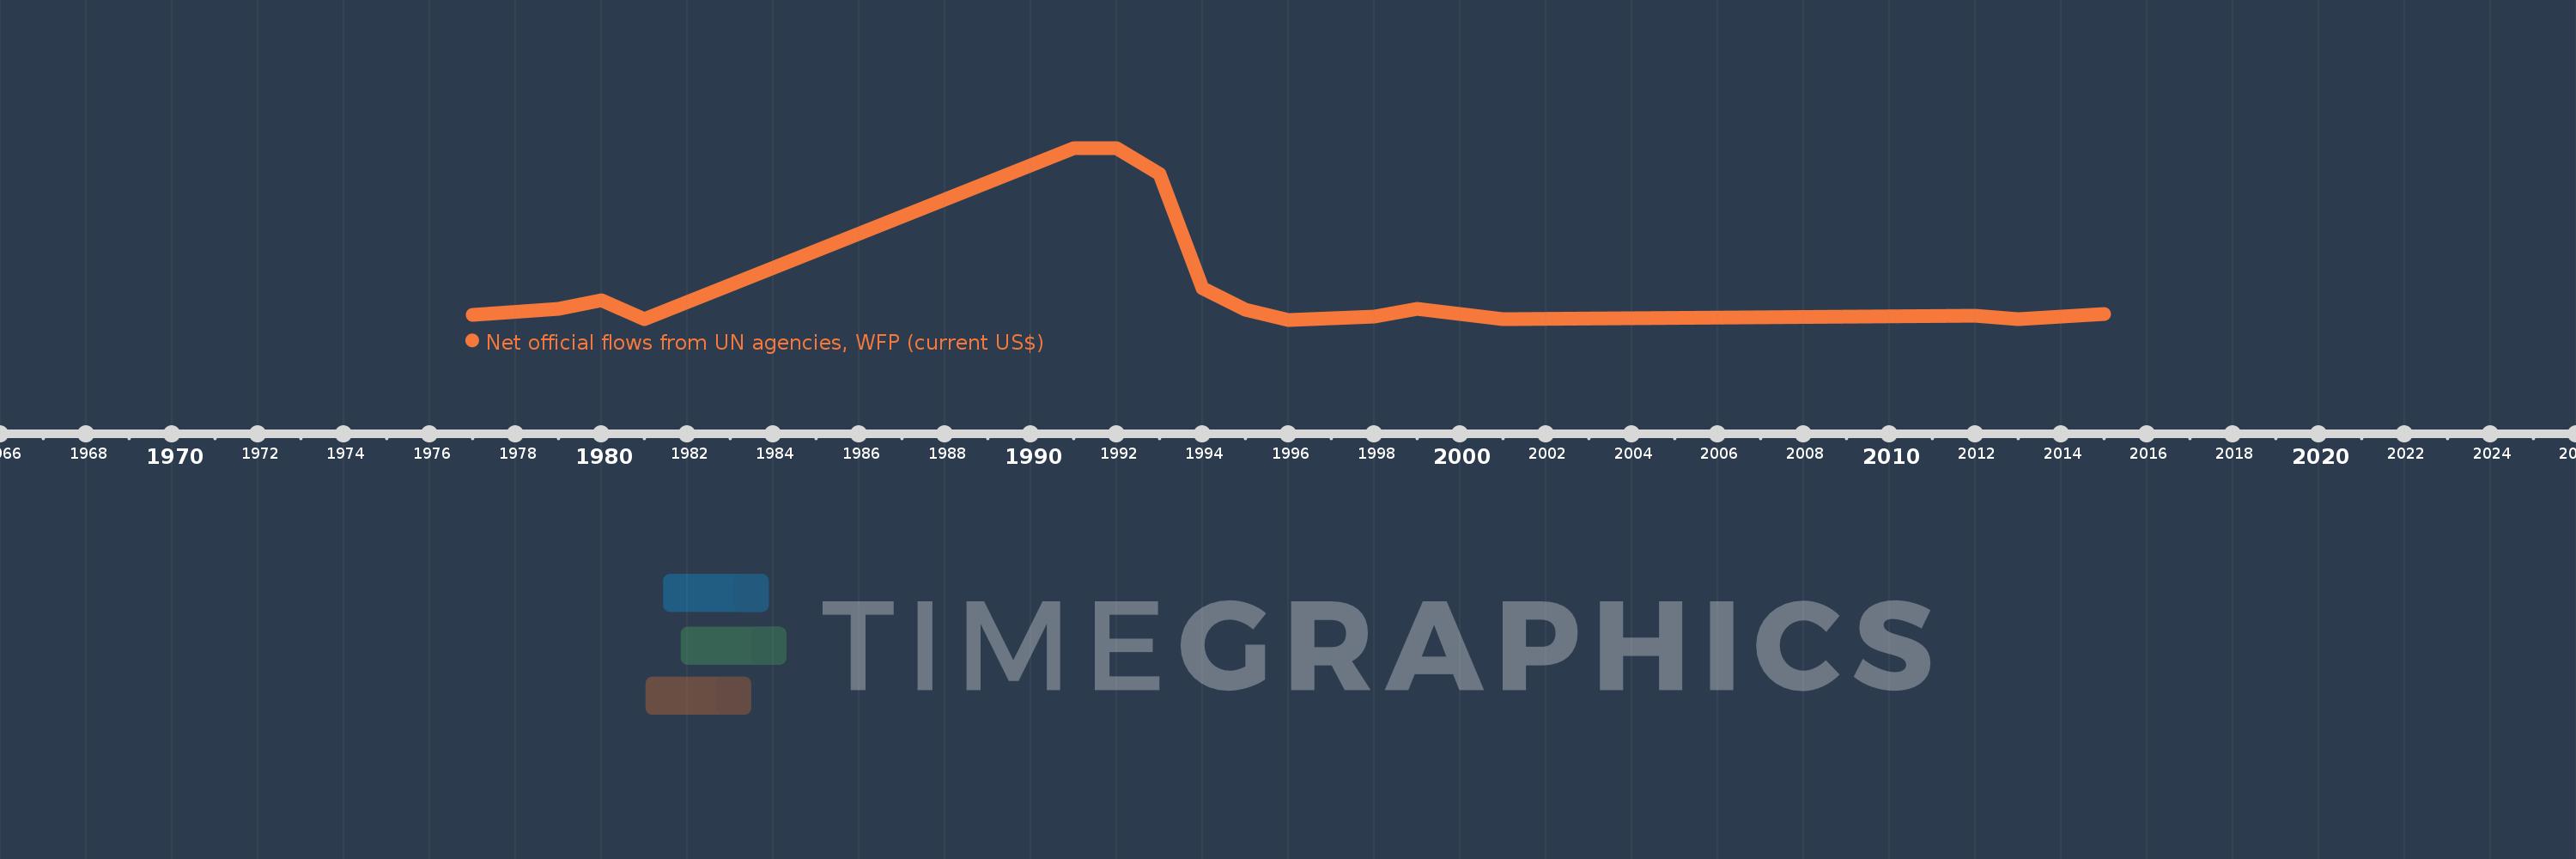
Diese Zeitleiste vorliegt die Graphik ab 1977 J. bis 2015 J. Thailand. Die Angaben bis 1976 J. sind nicht vorhanden. Die Zahl aktueller Beobachtungen nach Daten: 17.

Die Quelle (Bezeichnung):

Kennzahlen der Weltentwicklung

Die Quelle (Einrichtung):

Development Assistance Committee of the Organisation for Economic Co-operation and Development, Geographical Distribution of Financial Flows to Developing Countries, Development Co-operation Report, and International Development Statistics database. Data are available online at: www.oecd.org/dac/stats/idsonline.

Kategorien:

Aid Effectiveness

Es wurde aktualisiert:

23 Apr 2017 Jahr

Kennzahlen der Wertänderungen vom Jahr zum Jahr

im Durchschnitt:
5.528 Mln.
Minimum:
-130.0 Tsnd.
1 Jan 1996 Jahr
Maximum:
27.64 Mln.
1 Jan 1992 Jahr
Zum Datum der Beobachtung
Wert
Absolute Veränderung
Die Veränderung bezüglich dem vorherigen Wert
1 Jan 1977 Jahr
660.0 Tsnd.
+660.0 Tsnd.
0.0%
1 Jan 1979 Jahr
1.63 Mln.
+970.0 Tsnd.
146.97%
1 Jan 1980 Jahr
3.08 Mln.
+1.45 Mln.
88.96%
1 Jan 1981 Jahr
10.0 Tsnd.
-3.07 Mln.
-99.68%
1 Jan 1991 Jahr
27.62 Mln.
+27.61 Mln.
276.1 Tsnd.%
1 Jan 1992 Jahr
27.64 Mln.
+20.0 Tsnd.
0.07%
1 Jan 1993 Jahr
23.41 Mln.
-4.23 Mln.
-15.3%
1 Jan 1994 Jahr
4.97 Mln.
-18.44 Mln.
-78.77%
1 Jan 1995 Jahr
1.49 Mln.
-3.48 Mln.
-70.02%
1 Jan 1996 Jahr
-130.0 Tsnd.
-1.62 Mln.
-108.72%
1 Jan 1998 Jahr
380.0 Tsnd.
+510.0 Tsnd.
-392.31%
1 Jan 1999 Jahr
1.59 Mln.
+1.21 Mln.
318.42%
1 Jan 2001 Jahr
30.0 Tsnd.
-1.56 Mln.
-98.11%
1 Jan 2012 Jahr
470.0 Tsnd.
+440.0 Tsnd.
1.47 Tsnd.%
1 Jan 2013 Jahr
0.0
-470.0 Tsnd.
-100.0%
1 Jan 2014 Jahr
380.0 Tsnd.
+380.0 Tsnd.
%
1 Jan 2015 Jahr
740.0 Tsnd.
+360.0 Tsnd.
94.74%

Bewertung der Länder gemäß mit laufender Statistik nach Jahren