30
/de/
AIzaSyAYiBZKx7MnpbEhh9jyipgxe19OcubqV5w
April 1, 2024
138438
Georgia
GEO
true
2
1
Net official flows from UN agencies, WFP (current US$)
2014,2013,2012,2011,2010,2009,2008,2007,2006,2005,2004,2003,2002,2001,2000,1996,1995,1994
Download
Bibliothek der Globalstatistik →Georgia →

Net official flows from UN agencies, WFP (current US$)

Diese Statistik in anderen Ländern:

AfghanistanAlbaniaAlgeriaAngolaAntigua and BarbudaArab WorldArgentinaArmeniaAzerbaijanBangladeshBarbadosBelizeBeninBhutanBoliviaBosnia and HerzegovinaBotswanaBrazilBulgariaBurkina FasoBurundiCabo VerdeCambodiaCameroonCaribbean small statesCentral African RepublicCentral Europe and the BalticsChadChileChinaColombiaComorosCongo, Dem. Rep.Congo, Rep.Costa RicaCote d'IvoireCubaCyprusDjiboutiDominicaDominican RepublicEast Asia & PacificEast Asia & Pacific (excluding high income)East Asia & Pacific (IDA & IBRD countries)EcuadorEgypt, Arab Rep.El SalvadorEquatorial GuineaEritreaEstoniaEthiopiaEuro areaEurope & Central AsiaEurope & Central Asia (excluding high income)Europe & Central Asia (IDA & IBRD countries)European UnionFijiFragile and conflict affected situationsGabonGambia, TheGeorgiaGhanaGrenadaGuatemalaGuineaGuinea-BissauGuyanaHaitiHeavily indebted poor countries (HIPC)High incomeHondurasIBRD onlyIDA & IBRD totalIDA blendIDA onlyIDA totalIndiaIndonesiaIran, Islamic Rep.IraqJamaicaJordanKenyaKorea, Dem. People’s Rep.Korea, Rep.KuwaitKyrgyz RepublicLao PDRLatin America & Caribbean Latin America & Caribbean (excluding high income)Latin America & the Caribbean (IDA & IBRD countries)Least developed countries: UN classificationLebanonLesothoLiberiaLibyaLow & middle incomeLow incomeLower middle incomeMacedonia, FYRMadagascarMalawiMalaysiaMaldivesMaliMaltaMauritaniaMauritiusMexicoMiddle East & North AfricaMiddle East & North Africa (excluding high income)Middle East & North Africa (IDA & IBRD countries)Middle incomeMoldovaMongoliaMoroccoMozambiqueMyanmarNamibiaNepalNicaraguaNigerNigeriaOECD membersOmanOther small statesPacific island small statesPakistanPanamaPapua New GuineaParaguayPeruPhilippinesPolandRomaniaRussian FederationRwandaSamoaSao Tome and PrincipeSenegalSerbiaSeychellesSierra LeoneSingaporeSmall statesSolomon IslandsSomaliaSouth AfricaSouth AsiaSouth Asia (IDA & IBRD)South SudanSri LankaSt. Kitts and NevisSt. LuciaSt. Vincent and the GrenadinesSub-Saharan Africa Sub-Saharan Africa (excluding high income)Sub-Saharan Africa (IDA & IBRD countries)SudanSurinameSwazilandSyrian Arab RepublicTajikistanTanzaniaThailandTimor-LesteTogoTongaTrinidad and TobagoTunisiaTurkeyTurkmenistanUgandaUnited Arab EmiratesUpper middle incomeUruguayVanuatuVenezuela, RBVietnamWest Bank and GazaWorldYemen, Rep.ZambiaZimbabwe

Zeitlinie:

Diese Zeitleiste vorliegt die Graphik ab 1994 J. bis 2014 J. Georgia. Die Angaben bis 1993 J. sind nicht vorhanden. Die Zahl aktueller Beobachtungen nach Daten: 18.

Die Quelle (Bezeichnung):

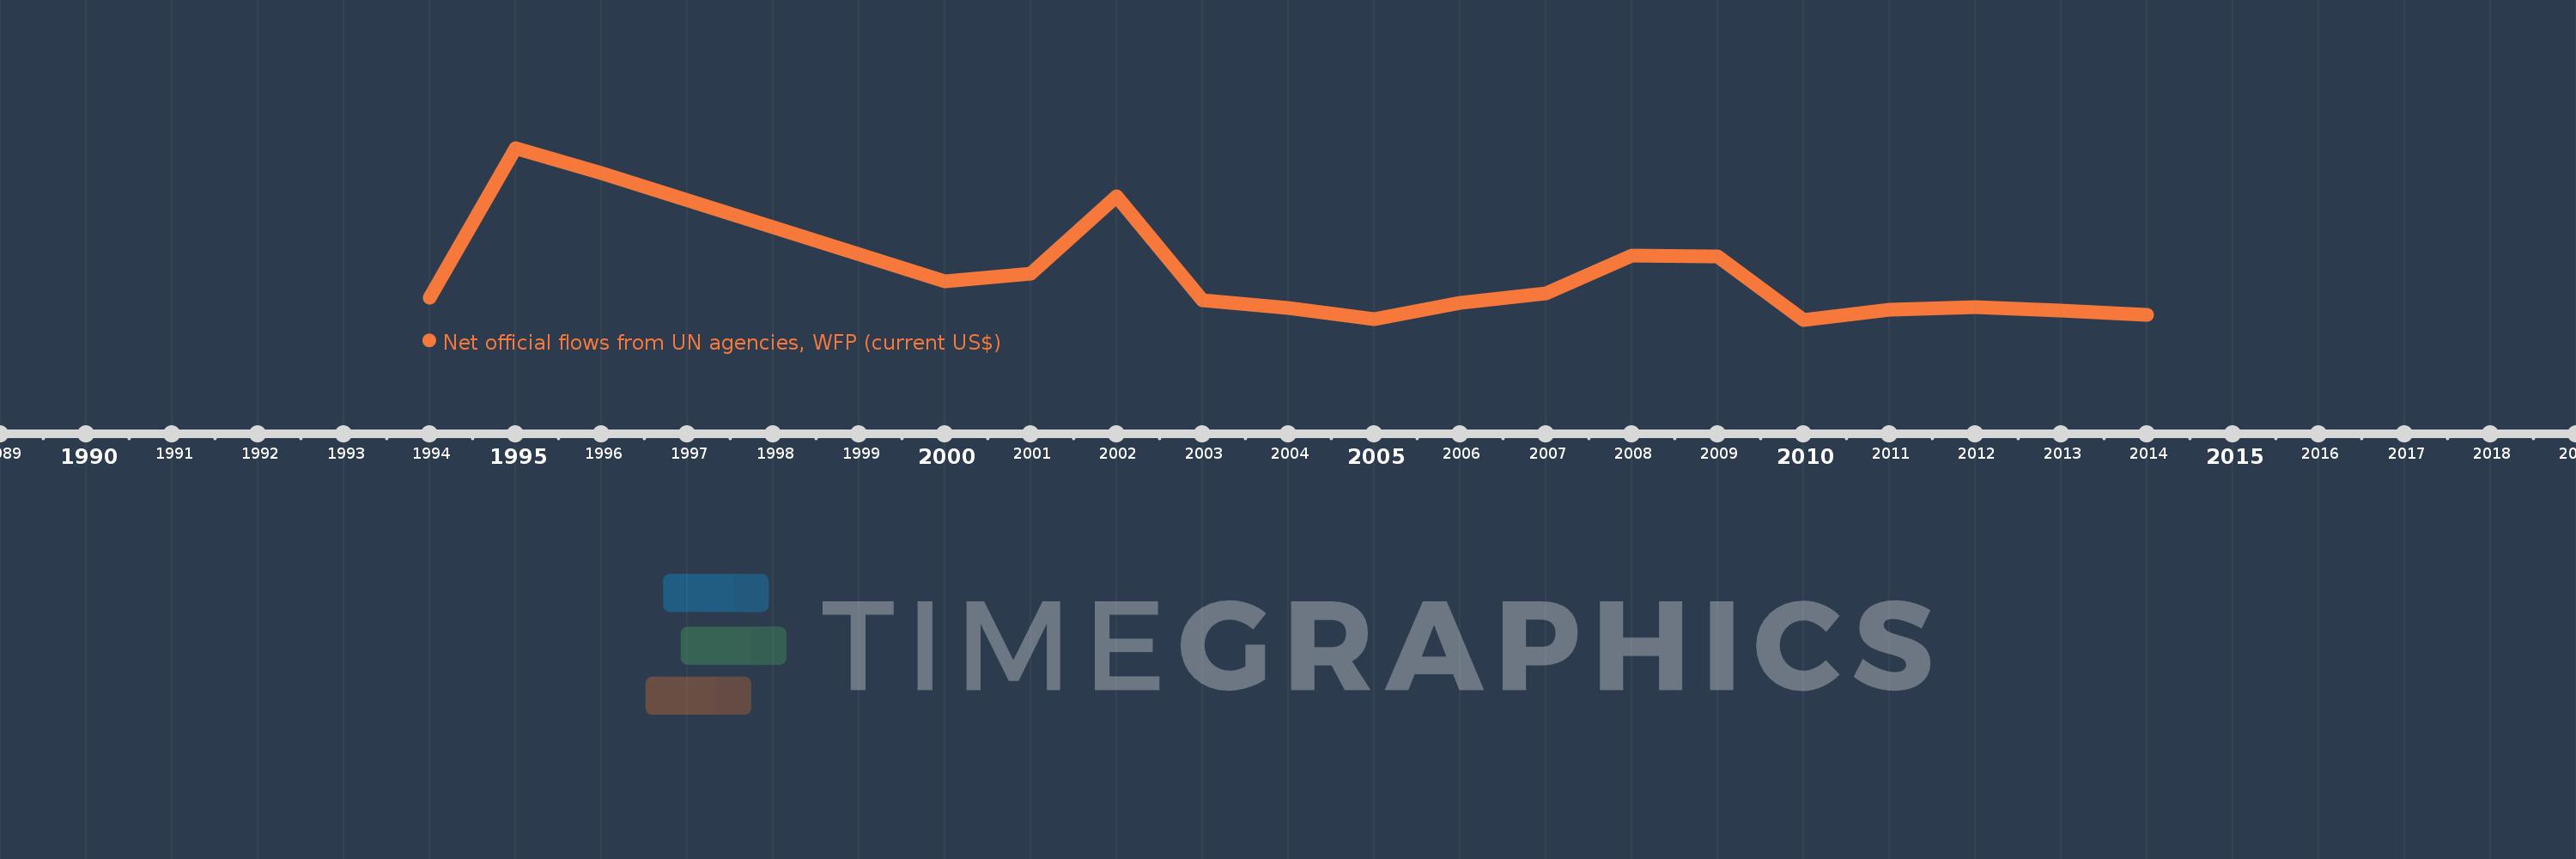
Kennzahlen der Weltentwicklung

Die Quelle (Einrichtung):

Development Assistance Committee of the Organisation for Economic Co-operation and Development, Geographical Distribution of Financial Flows to Developing Countries, Development Co-operation Report, and International Development Statistics database. Data are available online at: www.oecd.org/dac/stats/idsonline.

Kategorien:

Aid Effectiveness

Es wurde aktualisiert:

23 Apr 2017 Jahr

Kennzahlen der Wertänderungen vom Jahr zum Jahr

im Durchschnitt:
1.942 Mln.
Minimum:
30.0 Tsnd.
1 Jan 2010 Jahr
Maximum:
7.56 Mln.
1 Jan 1995 Jahr
Zum Datum der Beobachtung
Wert
Absolute Veränderung
Die Veränderung bezüglich dem vorherigen Wert
1 Jan 1994 Jahr
980.0 Tsnd.
+980.0 Tsnd.
0.0%
1 Jan 1995 Jahr
7.56 Mln.
+6.58 Mln.
671.43%
1 Jan 1996 Jahr
6.44 Mln.
-1.12 Mln.
-14.81%
1 Jan 2000 Jahr
1.7 Mln.
-4.74 Mln.
-73.6%
1 Jan 2001 Jahr
2.04 Mln.
+340.0 Tsnd.
20.0%
1 Jan 2002 Jahr
5.44 Mln.
+3.4 Mln.
166.67%
1 Jan 2003 Jahr
890.0 Tsnd.
-4.55 Mln.
-83.64%
1 Jan 2004 Jahr
530.0 Tsnd.
-360.0 Tsnd.
-40.45%
1 Jan 2005 Jahr
40.0 Tsnd.
-490.0 Tsnd.
-92.45%
1 Jan 2006 Jahr
780.0 Tsnd.
+740.0 Tsnd.
1.85 Tsnd.%
1 Jan 2007 Jahr
1.17 Mln.
+390.0 Tsnd.
50.0%
1 Jan 2008 Jahr
2.84 Mln.
+1.67 Mln.
142.74%
1 Jan 2009 Jahr
2.79 Mln.
-50.0 Tsnd.
-1.76%
1 Jan 2010 Jahr
30.0 Tsnd.
-2.76 Mln.
-98.92%
1 Jan 2011 Jahr
460.0 Tsnd.
+430.0 Tsnd.
1.43 Tsnd.%
1 Jan 2012 Jahr
600.0 Tsnd.
+140.0 Tsnd.
30.43%
1 Jan 2013 Jahr
440.0 Tsnd.
-160.0 Tsnd.
-26.67%
1 Jan 2014 Jahr
230.0 Tsnd.
-210.0 Tsnd.
-47.73%

Bewertung der Länder gemäß mit laufender Statistik nach Jahren