33
/de/
AIzaSyAYiBZKx7MnpbEhh9jyipgxe19OcubqV5w
August 1, 2025
170305
Korea, Rep.
KOR
true
2
1
Net official flows from UN agencies, WFP (current US$)
1983,1981,1980,1979,1978,1977,1976,1975,1974,1973,1972,1971,1970
Download
Bibliothek der Globalstatistik →Korea, Rep. →

Net official flows from UN agencies, WFP (current US$)

Diese Statistik in anderen Ländern:

AfghanistanAlbaniaAlgeriaAngolaAntigua and BarbudaArab WorldArgentinaArmeniaAzerbaijanBangladeshBarbadosBelizeBeninBhutanBoliviaBosnia and HerzegovinaBotswanaBrazilBulgariaBurkina FasoBurundiCabo VerdeCambodiaCameroonCaribbean small statesCentral African RepublicCentral Europe and the BalticsChadChileChinaColombiaComorosCongo, Dem. Rep.Congo, Rep.Costa RicaCote d'IvoireCubaCyprusDjiboutiDominicaDominican RepublicEast Asia & PacificEast Asia & Pacific (excluding high income)East Asia & Pacific (IDA & IBRD countries)EcuadorEgypt, Arab Rep.El SalvadorEquatorial GuineaEritreaEstoniaEthiopiaEuro areaEurope & Central AsiaEurope & Central Asia (excluding high income)Europe & Central Asia (IDA & IBRD countries)European UnionFijiFragile and conflict affected situationsGabonGambia, TheGeorgiaGhanaGrenadaGuatemalaGuineaGuinea-BissauGuyanaHaitiHeavily indebted poor countries (HIPC)High incomeHondurasIBRD onlyIDA & IBRD totalIDA blendIDA onlyIDA totalIndiaIndonesiaIran, Islamic Rep.IraqJamaicaJordanKenyaKorea, Dem. People’s Rep.Korea, Rep.KuwaitKyrgyz RepublicLao PDRLatin America & Caribbean Latin America & Caribbean (excluding high income)Latin America & the Caribbean (IDA & IBRD countries)Least developed countries: UN classificationLebanonLesothoLiberiaLibyaLow & middle incomeLow incomeLower middle incomeMacedonia, FYRMadagascarMalawiMalaysiaMaldivesMaliMaltaMauritaniaMauritiusMexicoMiddle East & North AfricaMiddle East & North Africa (excluding high income)Middle East & North Africa (IDA & IBRD countries)Middle incomeMoldovaMongoliaMoroccoMozambiqueMyanmarNamibiaNepalNicaraguaNigerNigeriaOECD membersOmanOther small statesPacific island small statesPakistanPanamaPapua New GuineaParaguayPeruPhilippinesPolandRomaniaRussian FederationRwandaSamoaSao Tome and PrincipeSenegalSerbiaSeychellesSierra LeoneSingaporeSmall statesSolomon IslandsSomaliaSouth AfricaSouth AsiaSouth Asia (IDA & IBRD)South SudanSri LankaSt. Kitts and NevisSt. LuciaSt. Vincent and the GrenadinesSub-Saharan Africa Sub-Saharan Africa (excluding high income)Sub-Saharan Africa (IDA & IBRD countries)SudanSurinameSwazilandSyrian Arab RepublicTajikistanTanzaniaThailandTimor-LesteTogoTongaTrinidad and TobagoTunisiaTurkeyTurkmenistanUgandaUnited Arab EmiratesUpper middle incomeUruguayVanuatuVenezuela, RBVietnamWest Bank and GazaWorldYemen, Rep.ZambiaZimbabwe

Zeitlinie:

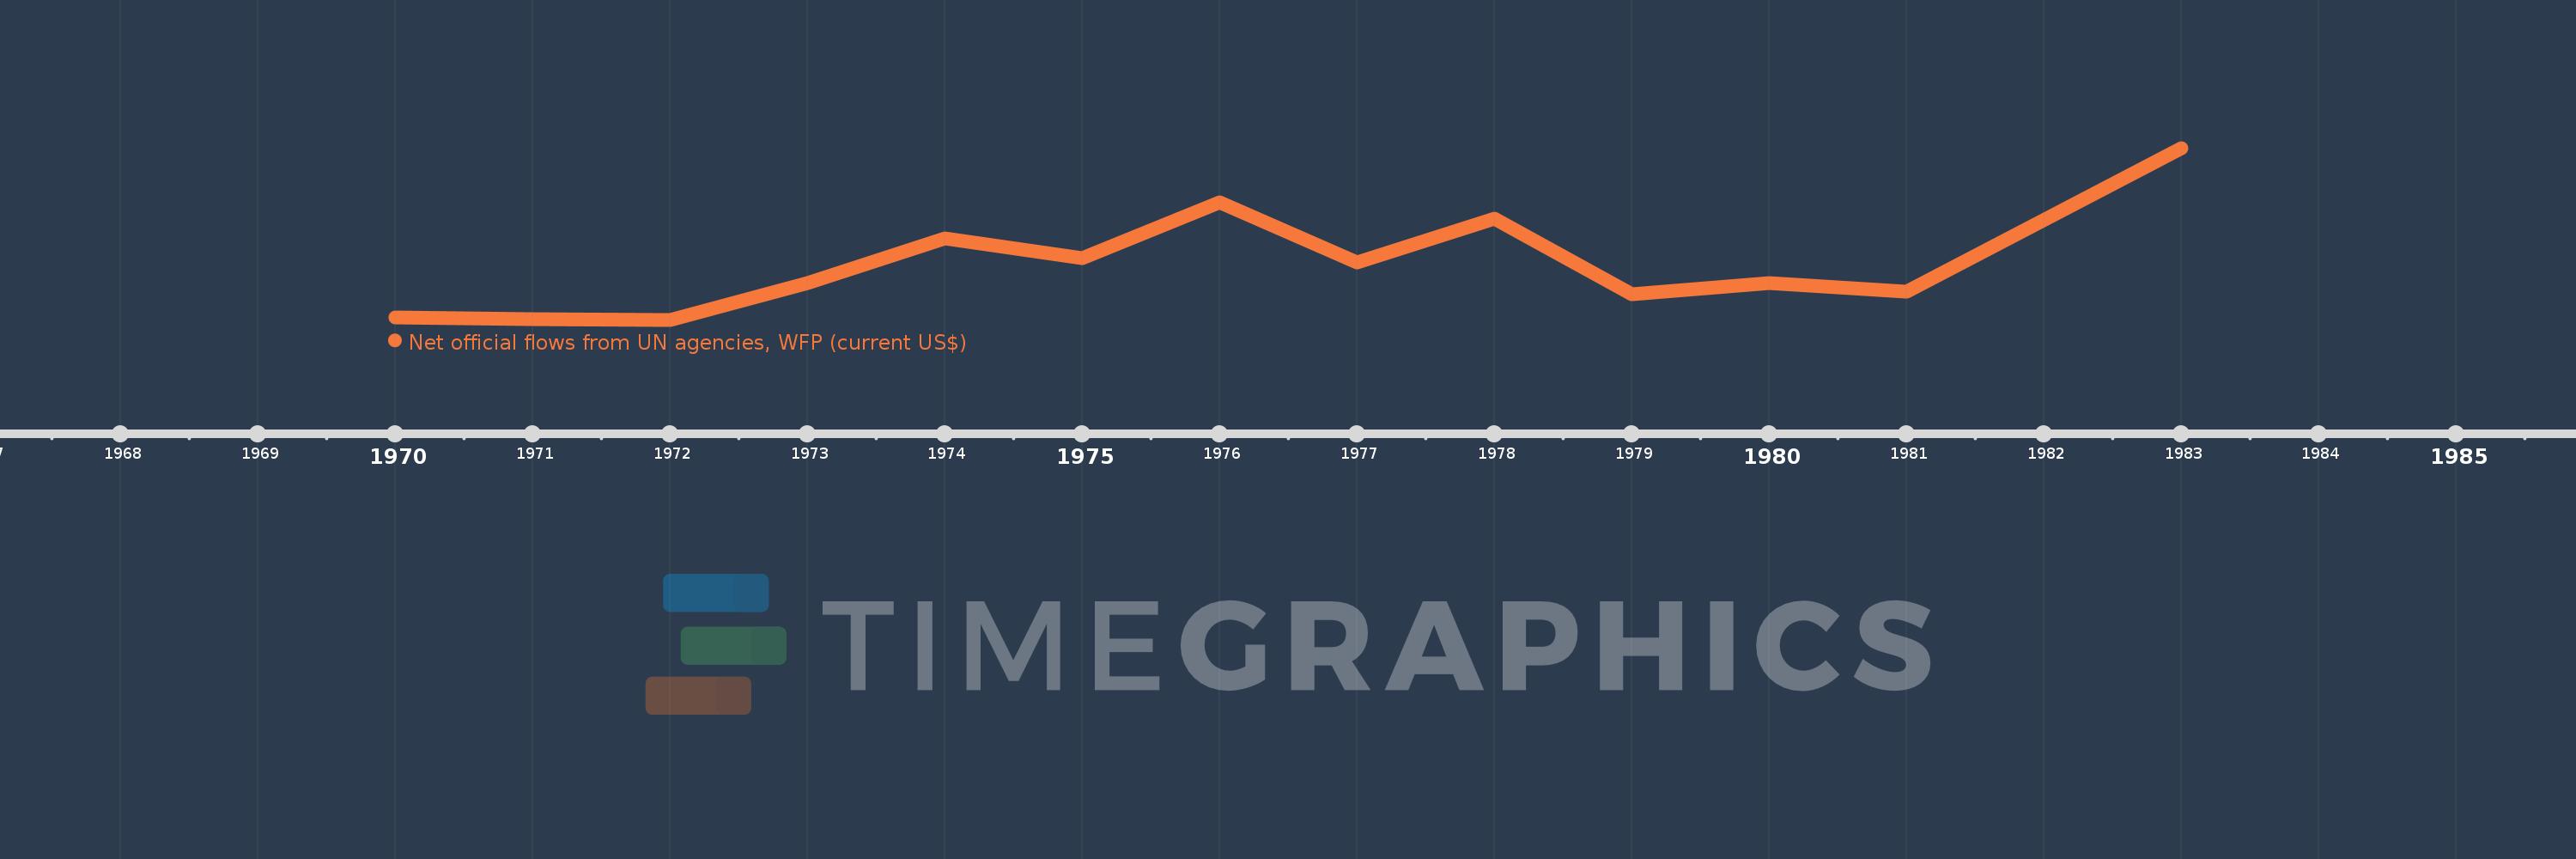
Diese Zeitleiste vorliegt die Graphik ab 1970 J. bis 1983 J. Korea, Rep.. Die Angaben bis 1969 J. sind nicht vorhanden. Die Zahl aktueller Beobachtungen nach Daten: 13.

Die Quelle (Bezeichnung):

Kennzahlen der Weltentwicklung

Die Quelle (Einrichtung):

Development Assistance Committee of the Organisation for Economic Co-operation and Development, Geographical Distribution of Financial Flows to Developing Countries, Development Co-operation Report, and International Development Statistics database. Data are available online at: www.oecd.org/dac/stats/idsonline.

Kategorien:

Aid Effectiveness

Es wurde aktualisiert:

23 Apr 2017 Jahr

Kennzahlen der Wertänderungen vom Jahr zum Jahr

im Durchschnitt:
7.577 Mln.
Minimum:
2.18 Mln.
1 Jan 1972 Jahr
Maximum:
18.92 Mln.
1 Jan 1983 Jahr
Zum Datum der Beobachtung
Wert
Absolute Veränderung
Die Veränderung bezüglich dem vorherigen Wert
1 Jan 1970 Jahr
2.44 Mln.
+2.44 Mln.
0.0%
1 Jan 1971 Jahr
2.25 Mln.
-190.0 Tsnd.
-7.79%
1 Jan 1972 Jahr
2.18 Mln.
-70.0 Tsnd.
-3.11%
1 Jan 1973 Jahr
5.75 Mln.
+3.57 Mln.
163.76%
1 Jan 1974 Jahr
10.08 Mln.
+4.33 Mln.
75.3%
1 Jan 1975 Jahr
8.19 Mln.
-1.89 Mln.
-18.75%
1 Jan 1976 Jahr
13.58 Mln.
+5.39 Mln.
65.81%
1 Jan 1977 Jahr
7.77 Mln.
-5.81 Mln.
-42.78%
1 Jan 1978 Jahr
12.02 Mln.
+4.25 Mln.
54.7%
1 Jan 1979 Jahr
4.68 Mln.
-7.34 Mln.
-61.06%
1 Jan 1980 Jahr
5.74 Mln.
+1.06 Mln.
22.65%
1 Jan 1981 Jahr
4.9 Mln.
-840.0 Tsnd.
-14.63%
1 Jan 1983 Jahr
18.92 Mln.
+14.02 Mln.
286.12%

Bewertung der Länder gemäß mit laufender Statistik nach Jahren