33
/de/
AIzaSyAYiBZKx7MnpbEhh9jyipgxe19OcubqV5w
May 1, 2025
204458
Myanmar
MMR
true
2
1
Net official flows from UN agencies, WFP (current US$)
2014,2013,2012,2011,2010,2009,2008,2007,2006,2005,2004,2003,2002,1996,1992,1991,1984,1981,1980,1976
Download
Bibliothek der Globalstatistik →Myanmar →

Net official flows from UN agencies, WFP (current US$)

Diese Statistik in anderen Ländern:

AfghanistanAlbaniaAlgeriaAngolaAntigua and BarbudaArab WorldArgentinaArmeniaAzerbaijanBangladeshBarbadosBelizeBeninBhutanBoliviaBosnia and HerzegovinaBotswanaBrazilBulgariaBurkina FasoBurundiCabo VerdeCambodiaCameroonCaribbean small statesCentral African RepublicCentral Europe and the BalticsChadChileChinaColombiaComorosCongo, Dem. Rep.Congo, Rep.Costa RicaCote d'IvoireCubaCyprusDjiboutiDominicaDominican RepublicEast Asia & PacificEast Asia & Pacific (excluding high income)East Asia & Pacific (IDA & IBRD countries)EcuadorEgypt, Arab Rep.El SalvadorEquatorial GuineaEritreaEstoniaEthiopiaEuro areaEurope & Central AsiaEurope & Central Asia (excluding high income)Europe & Central Asia (IDA & IBRD countries)European UnionFijiFragile and conflict affected situationsGabonGambia, TheGeorgiaGhanaGrenadaGuatemalaGuineaGuinea-BissauGuyanaHaitiHeavily indebted poor countries (HIPC)High incomeHondurasIBRD onlyIDA & IBRD totalIDA blendIDA onlyIDA totalIndiaIndonesiaIran, Islamic Rep.IraqJamaicaJordanKenyaKorea, Dem. People’s Rep.Korea, Rep.KuwaitKyrgyz RepublicLao PDRLatin America & Caribbean Latin America & Caribbean (excluding high income)Latin America & the Caribbean (IDA & IBRD countries)Least developed countries: UN classificationLebanonLesothoLiberiaLibyaLow & middle incomeLow incomeLower middle incomeMacedonia, FYRMadagascarMalawiMalaysiaMaldivesMaliMaltaMauritaniaMauritiusMexicoMiddle East & North AfricaMiddle East & North Africa (excluding high income)Middle East & North Africa (IDA & IBRD countries)Middle incomeMoldovaMongoliaMoroccoMozambiqueMyanmarNamibiaNepalNicaraguaNigerNigeriaOECD membersOmanOther small statesPacific island small statesPakistanPanamaPapua New GuineaParaguayPeruPhilippinesPolandRomaniaRussian FederationRwandaSamoaSao Tome and PrincipeSenegalSerbiaSeychellesSierra LeoneSingaporeSmall statesSolomon IslandsSomaliaSouth AfricaSouth AsiaSouth Asia (IDA & IBRD)South SudanSri LankaSt. Kitts and NevisSt. LuciaSt. Vincent and the GrenadinesSub-Saharan Africa Sub-Saharan Africa (excluding high income)Sub-Saharan Africa (IDA & IBRD countries)SudanSurinameSwazilandSyrian Arab RepublicTajikistanTanzaniaThailandTimor-LesteTogoTongaTrinidad and TobagoTunisiaTurkeyTurkmenistanUgandaUnited Arab EmiratesUpper middle incomeUruguayVanuatuVenezuela, RBVietnamWest Bank and GazaWorldYemen, Rep.ZambiaZimbabwe

Zeitlinie:

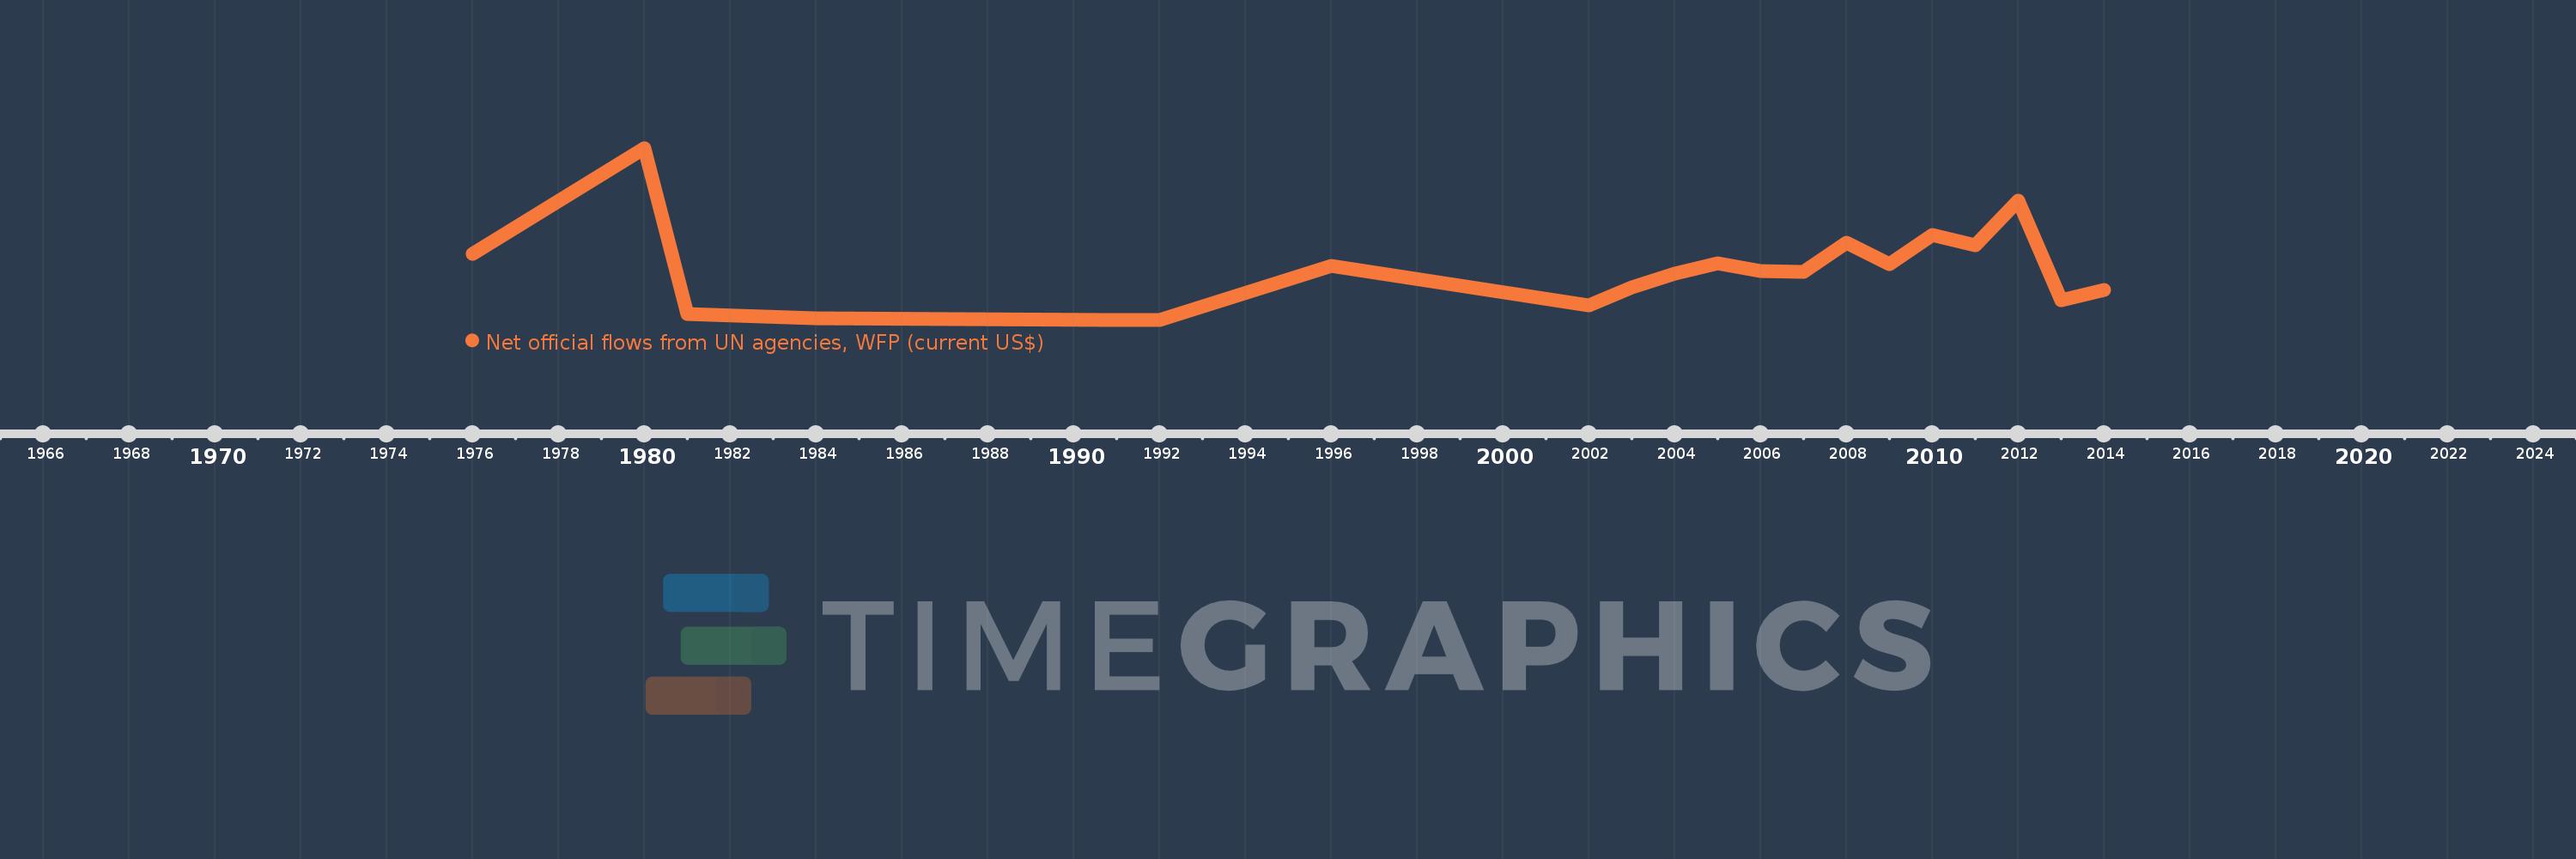
Diese Zeitleiste vorliegt die Graphik ab 1976 J. bis 2014 J. Myanmar. Die Angaben bis 1975 J. sind nicht vorhanden. Die Zahl aktueller Beobachtungen nach Daten: 20.

Die Quelle (Bezeichnung):

Kennzahlen der Weltentwicklung

Die Quelle (Einrichtung):

Development Assistance Committee of the Organisation for Economic Co-operation and Development, Geographical Distribution of Financial Flows to Developing Countries, Development Co-operation Report, and International Development Statistics database. Data are available online at: www.oecd.org/dac/stats/idsonline.

Kategorien:

Aid Effectiveness

Es wurde aktualisiert:

23 Apr 2017 Jahr

Kennzahlen der Wertänderungen vom Jahr zum Jahr

im Durchschnitt:
1.173 Mln.
Minimum:
10.0 Tsnd.
1 Jan 1991 Jahr
Maximum:
3.99 Mln.
1 Jan 1980 Jahr
Zum Datum der Beobachtung
Wert
Absolute Veränderung
Die Veränderung bezüglich dem vorherigen Wert
1 Jan 1976 Jahr
1.53 Mln.
+1.53 Mln.
0.0%
1 Jan 1980 Jahr
3.99 Mln.
+2.46 Mln.
160.78%
1 Jan 1981 Jahr
140.0 Tsnd.
-3.85 Mln.
-96.49%
1 Jan 1984 Jahr
50.0 Tsnd.
-90.0 Tsnd.
-64.29%
1 Jan 1991 Jahr
10.0 Tsnd.
-40.0 Tsnd.
-80.0%
1 Jan 1992 Jahr
10.0 Tsnd.
0.0
0.0%
1 Jan 1996 Jahr
1.25 Mln.
+1.24 Mln.
12.4 Tsnd.%
1 Jan 2002 Jahr
350.0 Tsnd.
-900.0 Tsnd.
-72.0%
1 Jan 2003 Jahr
760.0 Tsnd.
+410.0 Tsnd.
117.14%
1 Jan 2004 Jahr
1.07 Mln.
+310.0 Tsnd.
40.79%
1 Jan 2005 Jahr
1.32 Mln.
+250.0 Tsnd.
23.36%
1 Jan 2006 Jahr
1.13 Mln.
-190.0 Tsnd.
-14.39%
1 Jan 2007 Jahr
1.12 Mln.
-10.0 Tsnd.
-0.88%
1 Jan 2008 Jahr
1.79 Mln.
+670.0 Tsnd.
59.82%
1 Jan 2009 Jahr
1.29 Mln.
-500.0 Tsnd.
-27.93%
1 Jan 2010 Jahr
1.97 Mln.
+680.0 Tsnd.
52.71%
1 Jan 2011 Jahr
1.74 Mln.
-230.0 Tsnd.
-11.68%
1 Jan 2012 Jahr
2.77 Mln.
+1.03 Mln.
59.2%
1 Jan 2013 Jahr
460.0 Tsnd.
-2.31 Mln.
-83.39%
1 Jan 2014 Jahr
700.0 Tsnd.
+240.0 Tsnd.
52.17%

Bewertung der Länder gemäß mit laufender Statistik nach Jahren