33
/de/
AIzaSyAYiBZKx7MnpbEhh9jyipgxe19OcubqV5w
August 1, 2025
255592
Swaziland
SWZ
true
2
1
Percentage of male teachers in primary education who are trained, male (%)
2014,2013,2012,2011,2010,2008,2007,2006,2005,2004,2003,2001,2000
Download
Bibliothek der Globalstatistik →Swaziland →

Percentage of male teachers in primary education who are trained, male (%)

Diese Statistik in anderen Ländern:

AlgeriaAndorraAngolaAntigua and BarbudaArab WorldArmeniaArubaAzerbaijanBahamas, TheBahrainBangladeshBarbadosBelarusBelizeBeninBermudaBhutanBoliviaBotswanaBritish Virgin IslandsBrunei DarussalamBurkina FasoBurundiCabo VerdeCambodiaCameroonCaribbean small statesCayman IslandsCentral African RepublicColombiaComorosCongo, Dem. Rep.Congo, Rep.Costa RicaCote d'IvoireCroatiaCubaDjiboutiDominicaDominican RepublicEcuadorEgypt, Arab Rep.El SalvadorEquatorial GuineaEritreaEthiopiaFijiFragile and conflict affected situationsGabonGambia, TheGeorgiaGhanaGibraltarGrenadaGuineaGuinea-BissauGuyanaHeavily indebted poor countries (HIPC)HondurasHong Kong SAR, ChinaIDA blendIDA onlyIDA totalIran, Islamic Rep.IraqJamaicaKazakhstanKenyaKiribatiKuwaitKyrgyz RepublicLao PDRLeast developed countries: UN classificationLebanonLesothoLiberiaLow incomeMacao SAR, ChinaMadagascarMalawiMalaysiaMaldivesMaliMauritaniaMauritiusMiddle East & North AfricaMiddle East & North Africa (excluding high income)Middle East & North Africa (IDA & IBRD countries)MoldovaMongoliaMoroccoMozambiqueMyanmarNamibiaNauruNepalNicaraguaNigerNigeriaOmanOther small statesPacific island small statesPakistanPanamaParaguayPhilippinesPre-demographic dividendQatarRwandaSao Tome and PrincipeSaudi ArabiaSenegalSerbiaSeychellesSierra LeoneSingaporeSmall statesSolomon IslandsSouth AfricaSt. Kitts and NevisSt. LuciaSt. Vincent and the GrenadinesSub-Saharan Africa Sub-Saharan Africa (excluding high income)Sub-Saharan Africa (IDA & IBRD countries)SurinameSwazilandSyrian Arab RepublicTajikistanTanzaniaTogoTongaTrinidad and TobagoTunisiaTurks and Caicos IslandsUgandaUnited Arab EmiratesUzbekistanVietnamWest Bank and GazaZambiaZimbabwe

Zeitlinie:

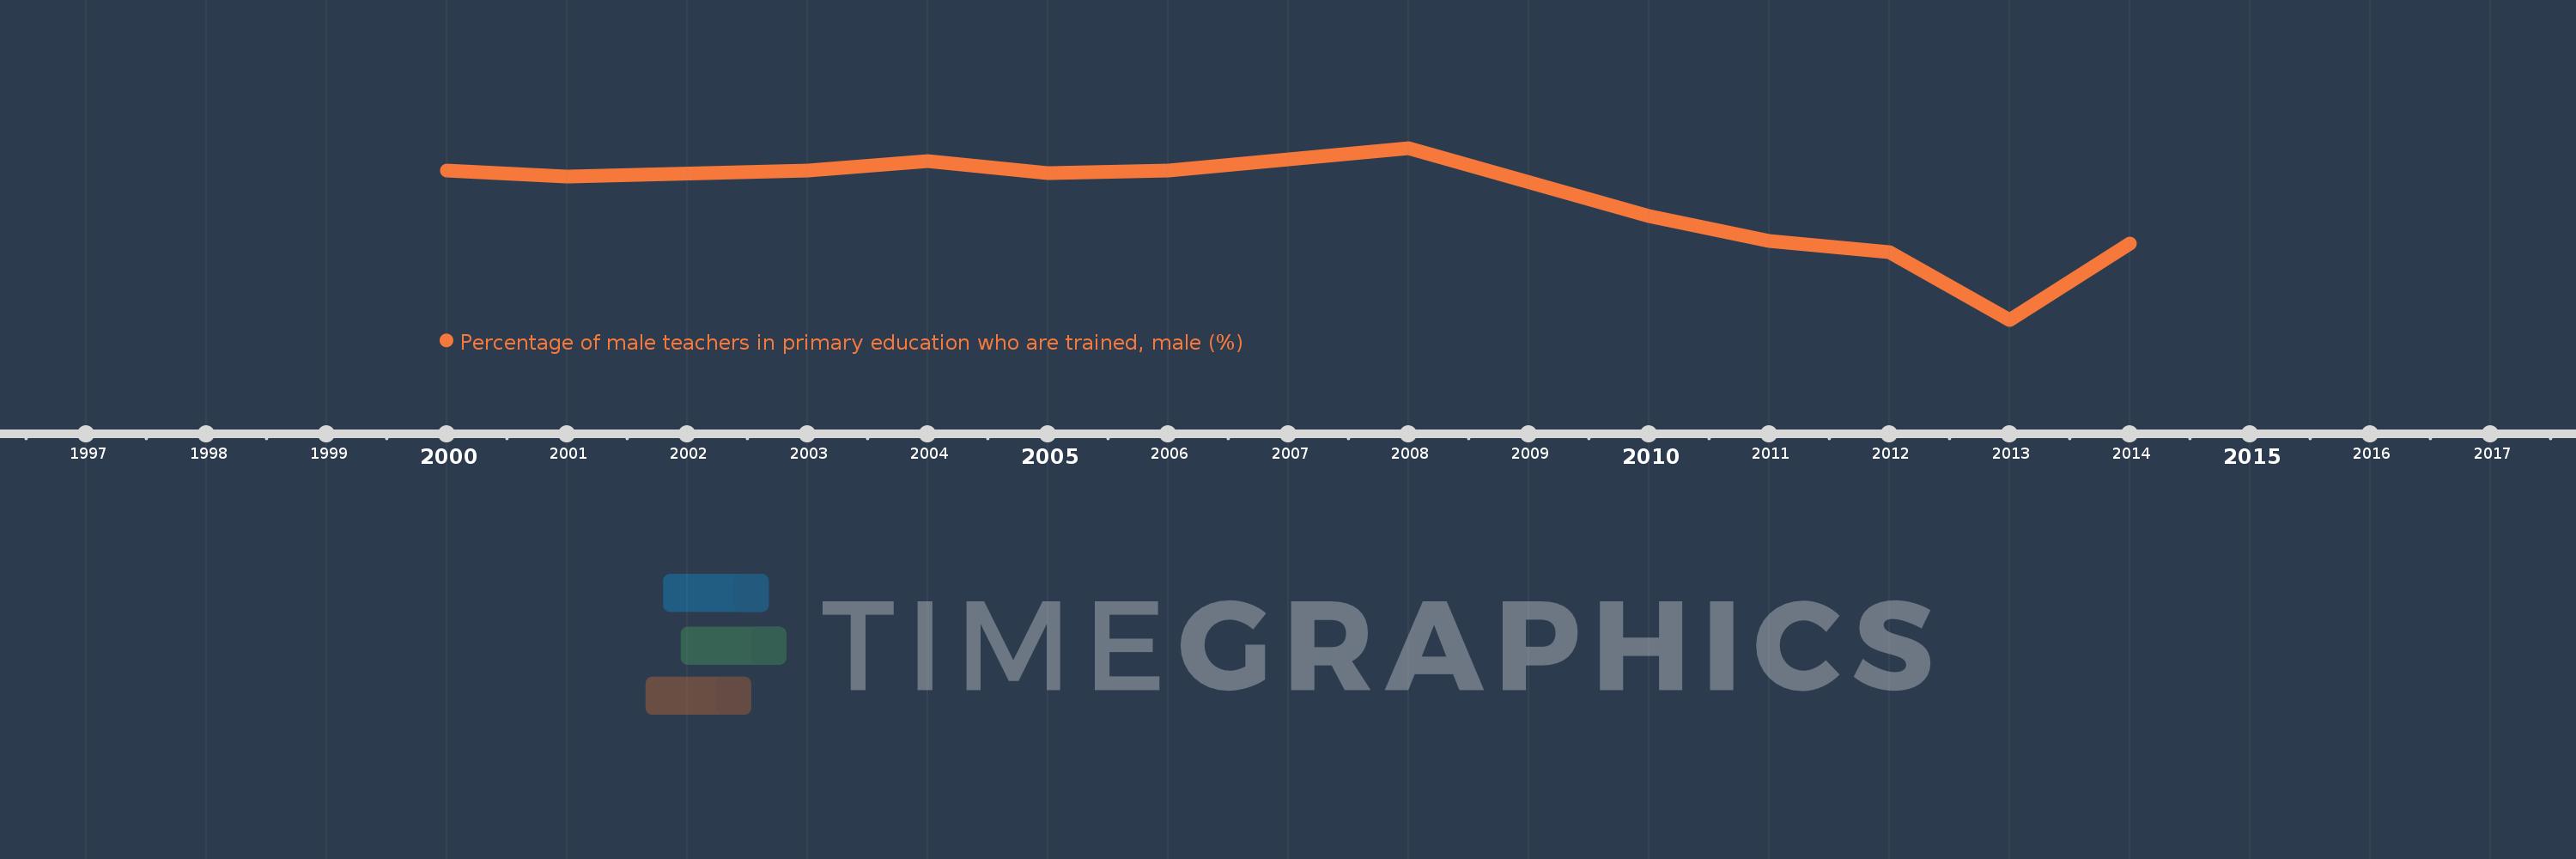
Diese Zeitleiste vorliegt die Graphik ab 2000 J. bis 2014 J. Swaziland. Die Angaben bis 1999 J. sind nicht vorhanden. Die Zahl aktueller Beobachtungen nach Daten: 13.

Die Quelle (Bezeichnung):

Kennzahlen der Weltentwicklung

Die Quelle (Einrichtung):

United Nations Educational, Scientific, and Cultural Organization (UNESCO) Institute for Statistics.

Kategorien:

Education, Gender

Es wurde aktualisiert:

23 Apr 2017 Jahr

Kennzahlen der Wertänderungen vom Jahr zum Jahr

im Durchschnitt:
83.998
Minimum:
63.417
1 Jan 2013 Jahr
Maximum:
93.012
1 Jan 2008 Jahr
Zum Datum der Beobachtung
Wert
Absolute Veränderung
Die Veränderung bezüglich dem vorherigen Wert
1 Jan 2000 Jahr
89.051
+89.051
0.0%
1 Jan 2001 Jahr
88.092
-0.958
-1.08%
1 Jan 2003 Jahr
89.09
+0.997
1.13%
1 Jan 2004 Jahr
90.677
+1.587
1.78%
1 Jan 2005 Jahr
88.623
-2.054
-2.27%
1 Jan 2006 Jahr
89.192
+0.569
0.64%
1 Jan 2007 Jahr
90.98
+1.788
2.0%
1 Jan 2008 Jahr
93.012
+2.032
2.23%
1 Jan 2010 Jahr
81.336
-11.676
-12.55%
1 Jan 2011 Jahr
76.919
-4.417
-5.43%
1 Jan 2012 Jahr
75.022
-1.898
-2.47%
1 Jan 2013 Jahr
63.417
-11.605
-15.47%
1 Jan 2014 Jahr
76.567
+13.15
20.74%

Bewertung der Länder gemäß mit laufender Statistik nach Jahren