30
/
AIzaSyAYiBZKx7MnpbEhh9jyipgxe19OcubqV5w
April 1, 2024
94031
Bulgaria
BGR
true
2
1
PNG, bonds (INT, current US$)
2016,2015,2014,2012,2011,2010,2009,2008,2007,2006,2005,2004
Public Timelines
FAQ
Menu
Public Timelines
FAQ
Public Timelines
FAQ
For education
For educational institutions
For teachers
For students
Open cabinet
For educational institutions
For teachers
For students
Open cabinet
Create
Close
Create a timeline
Public timelines
Library
FAQ
Download
Global statistics library
→
Bulgaria
→
PNG, bonds (INT, current US$)
This statistics in other country:
Argentina
Botswana
Brazil
Bulgaria
China
Colombia
Costa Rica
Dominican Republic
East Asia & Pacific (excluding high income)
Ecuador
Egypt, Arab Rep.
El Salvador
Europe & Central Asia (excluding high income)
Georgia
Ghana
Guatemala
IDA only
India
Indonesia
Jamaica
Kazakhstan
Lao PDR
Latin America & Caribbean (excluding high income)
Lebanon
Low & middle income
Lower middle income
Malaysia
Mexico
Middle East & North Africa (excluding high income)
Middle income
Mongolia
Nigeria
Pakistan
Panama
Paraguay
Peru
Philippines
Romania
Russian Federation
Serbia
South Africa
South Asia
Sri Lanka
Sub-Saharan Africa (excluding high income)
Thailand
Turkey
Ukraine
Upper middle income
Venezuela, RB
Vietnam
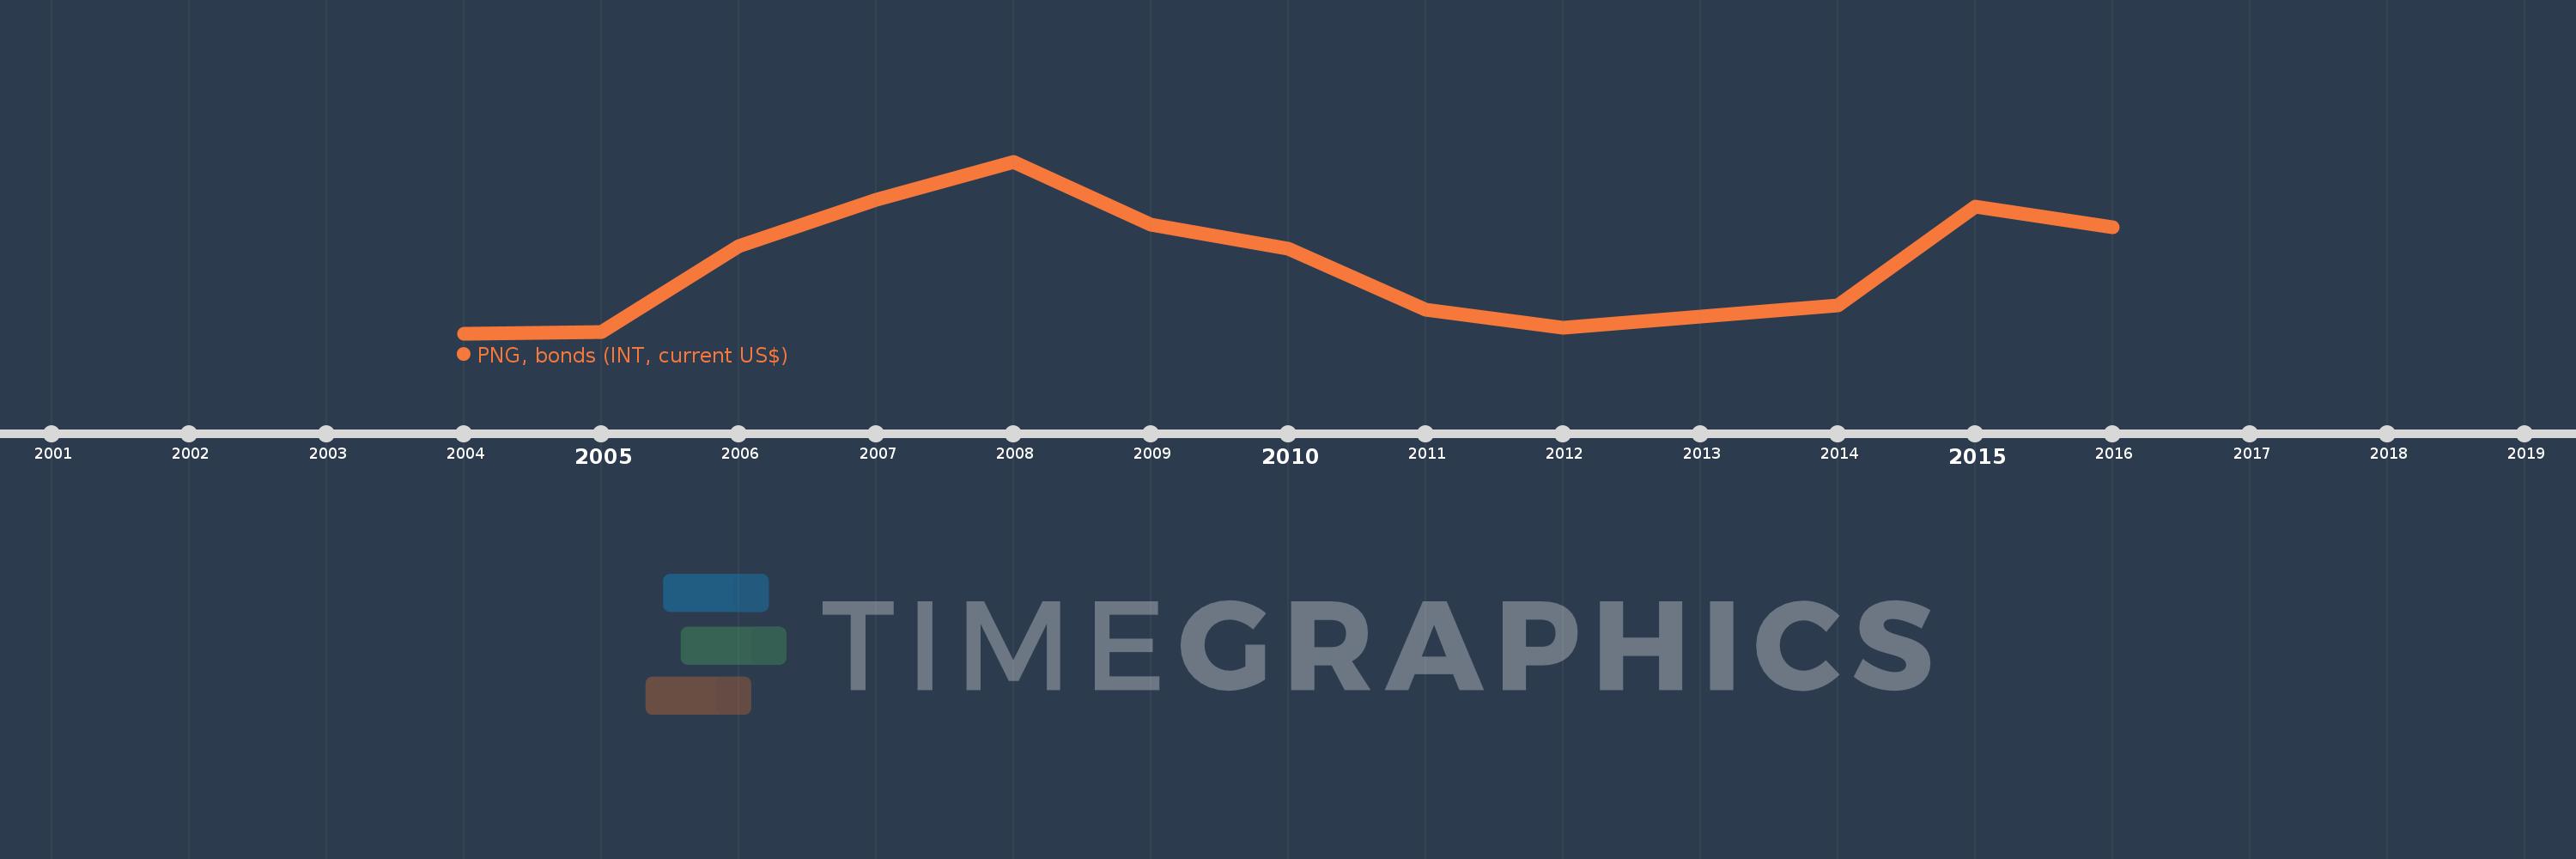
Timeline:
This timeline shows a graph from
2004
to
2016
of Bulgaria. No data until
2003
. Number of actual observations by date:
12
.
Source name:
World Development Indicators
Source organization:
World Bank, International Debt Statistics.
Categories, topics:
External Debt
Last updated:
apr 23, 2017
Indicators value changes by year
Meaning:
25.875 mln
Minimum:
4.195 mln
jan 1, 2004
Maximum:
55.179 mln
jan 1, 2008
At the date of observation
Value
Absolute change
Change from the previous value
jan 1, 2004
4.195 mln
+4.195 mln
0.0%
jan 1, 2005
4.514 mln
+319.0K
7.6%
jan 1, 2006
30.149 mln
+25.635 mln
567.9%
jan 1, 2007
43.933 mln
+13.784 mln
45.72%
jan 1, 2008
55.179 mln
+11.246 mln
25.6%
jan 1, 2009
36.422 mln
-18.757 mln
-33.99%
jan 1, 2010
29.191 mln
-7.231 mln
-19.85%
jan 1, 2011
11.111 mln
-18.08 mln
-61.94%
jan 1, 2012
5.826 mln
-5.285 mln
-47.57%
jan 1, 2014
12.374 mln
+6.548 mln
112.39%
jan 1, 2015
41.895 mln
+29.521 mln
238.57%
jan 1, 2016
35.708 mln
-6.187 mln
-14.77%
Ranking of countries by current statistics by years
About & Feedback
Terms
Privacy
Library
2024
©
Time.Graphics
Support 24/7
Cabinet
Get premium
Donate
The service accepts bank transfer (ACH, Wire) or cards (Visa, MasterCard, etc). Processed by Stripe.
Secured with SSL
Excellent (Trustpilot Reviews)
Based on 115+ reviews
Write your own review on
Trustpilot.com
