29
/
en
AIzaSyAYiBZKx7MnpbEhh9jyipgxe19OcubqV5w
April 1, 2024
199635
Mongolia
MNG
true
2
1
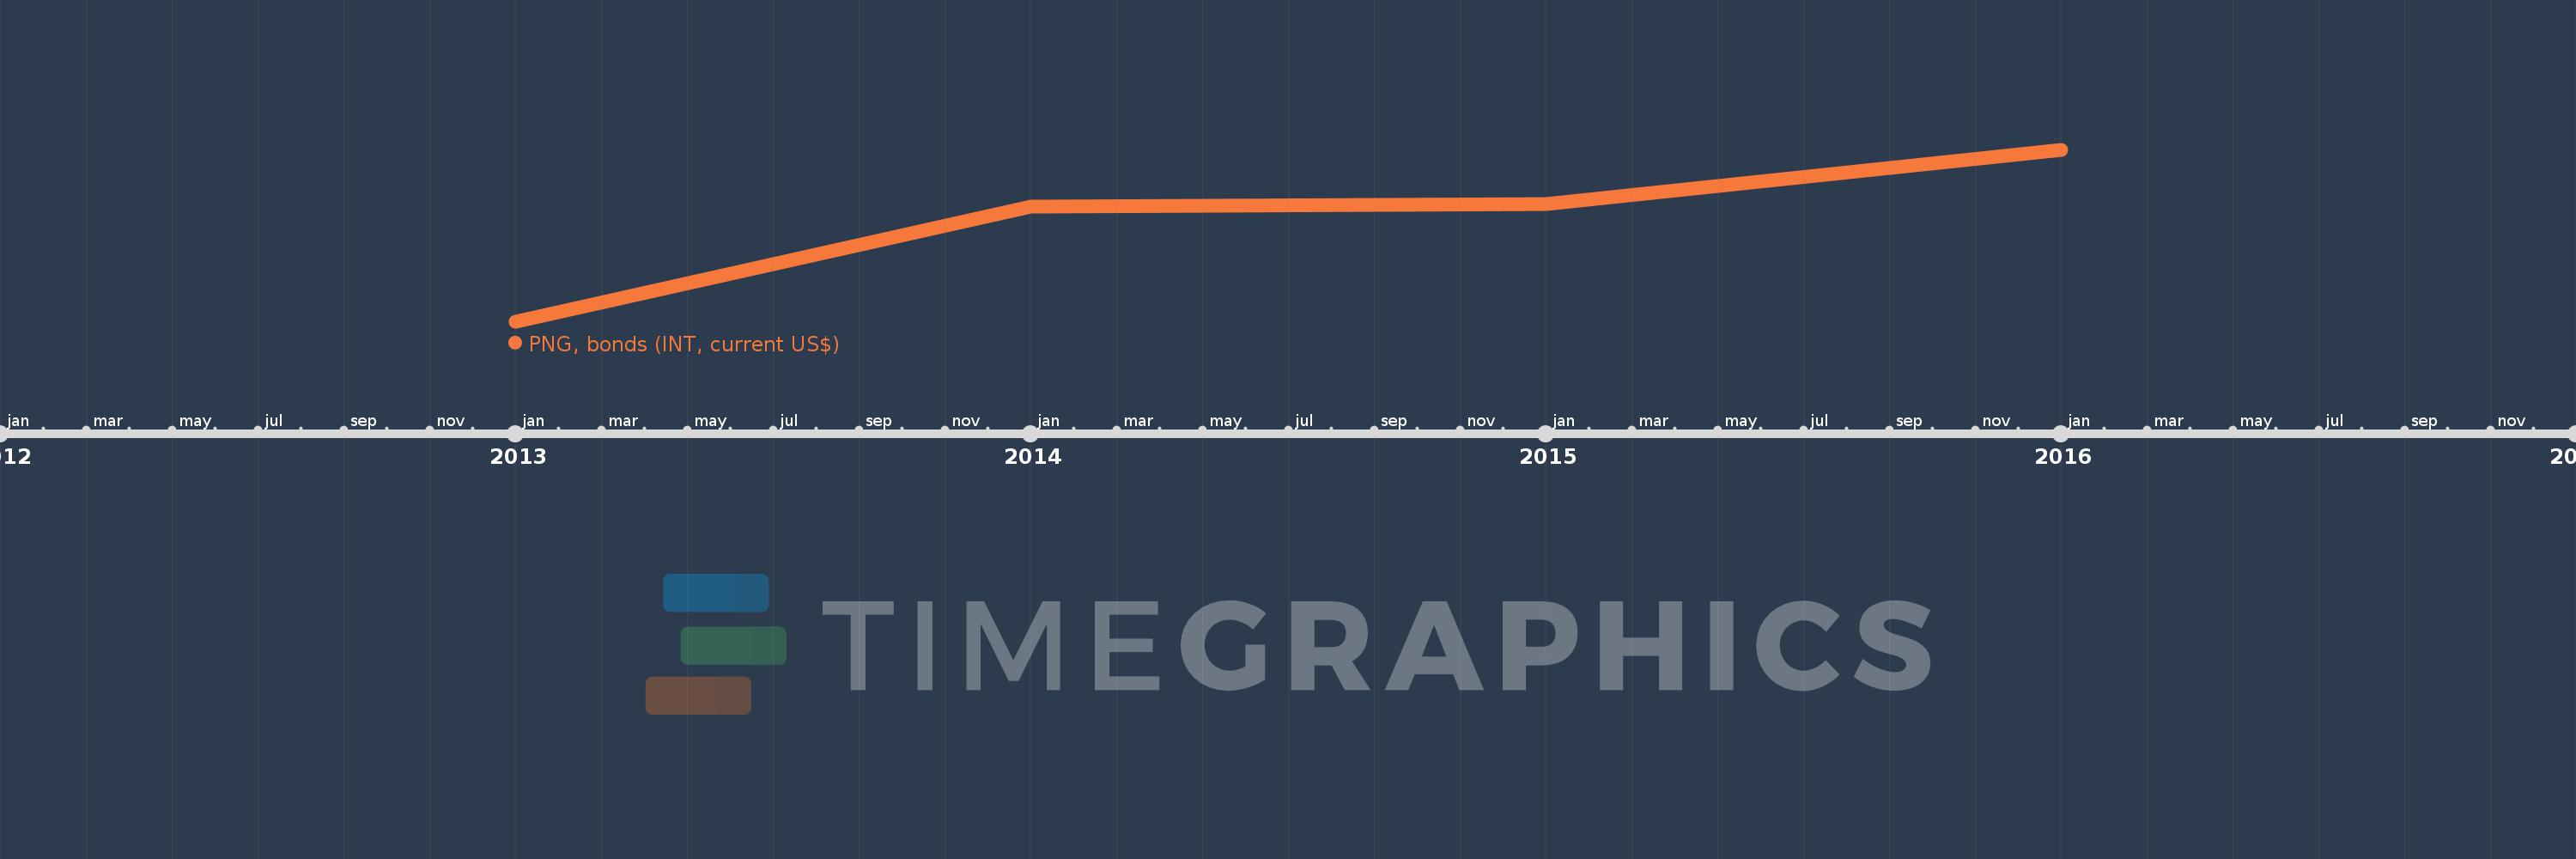
PNG, bonds (INT, current US$)
2016,2015,2014,2013
This statistics in other country:
Timeline:
This timeline shows a graph from 2013 to 2016 of Mongolia. No data until 2012. Number of actual observations by date: 4.
Source name:
World Development Indicators
Source organization:
World Bank, International Debt Statistics.
Categories, topics:
External Debt
Last updated:
apr 23, 2017
Indicators value changes by year
Minimum:
26.625 mln
jan 1, 2013
Maximum:
104.066 mln
jan 1, 2016
At the date of observation
Value
Absolute change
Change from previous value
jan 1, 2013
26.625 mln
+26.625 mln
0.0%
jan 1, 2014
78.75 mln
+52.125 mln
195.77%
jan 1, 2015
79.685 mln
+935.0K
1.19%
jan 1, 2016
104.066 mln
+24.381 mln
30.6%
Ranking of countries by current statistics by years


Comments: