29
/
en
AIzaSyAYiBZKx7MnpbEhh9jyipgxe19OcubqV5w
April 1, 2024
246094
South Africa
ZAF
true
2
1
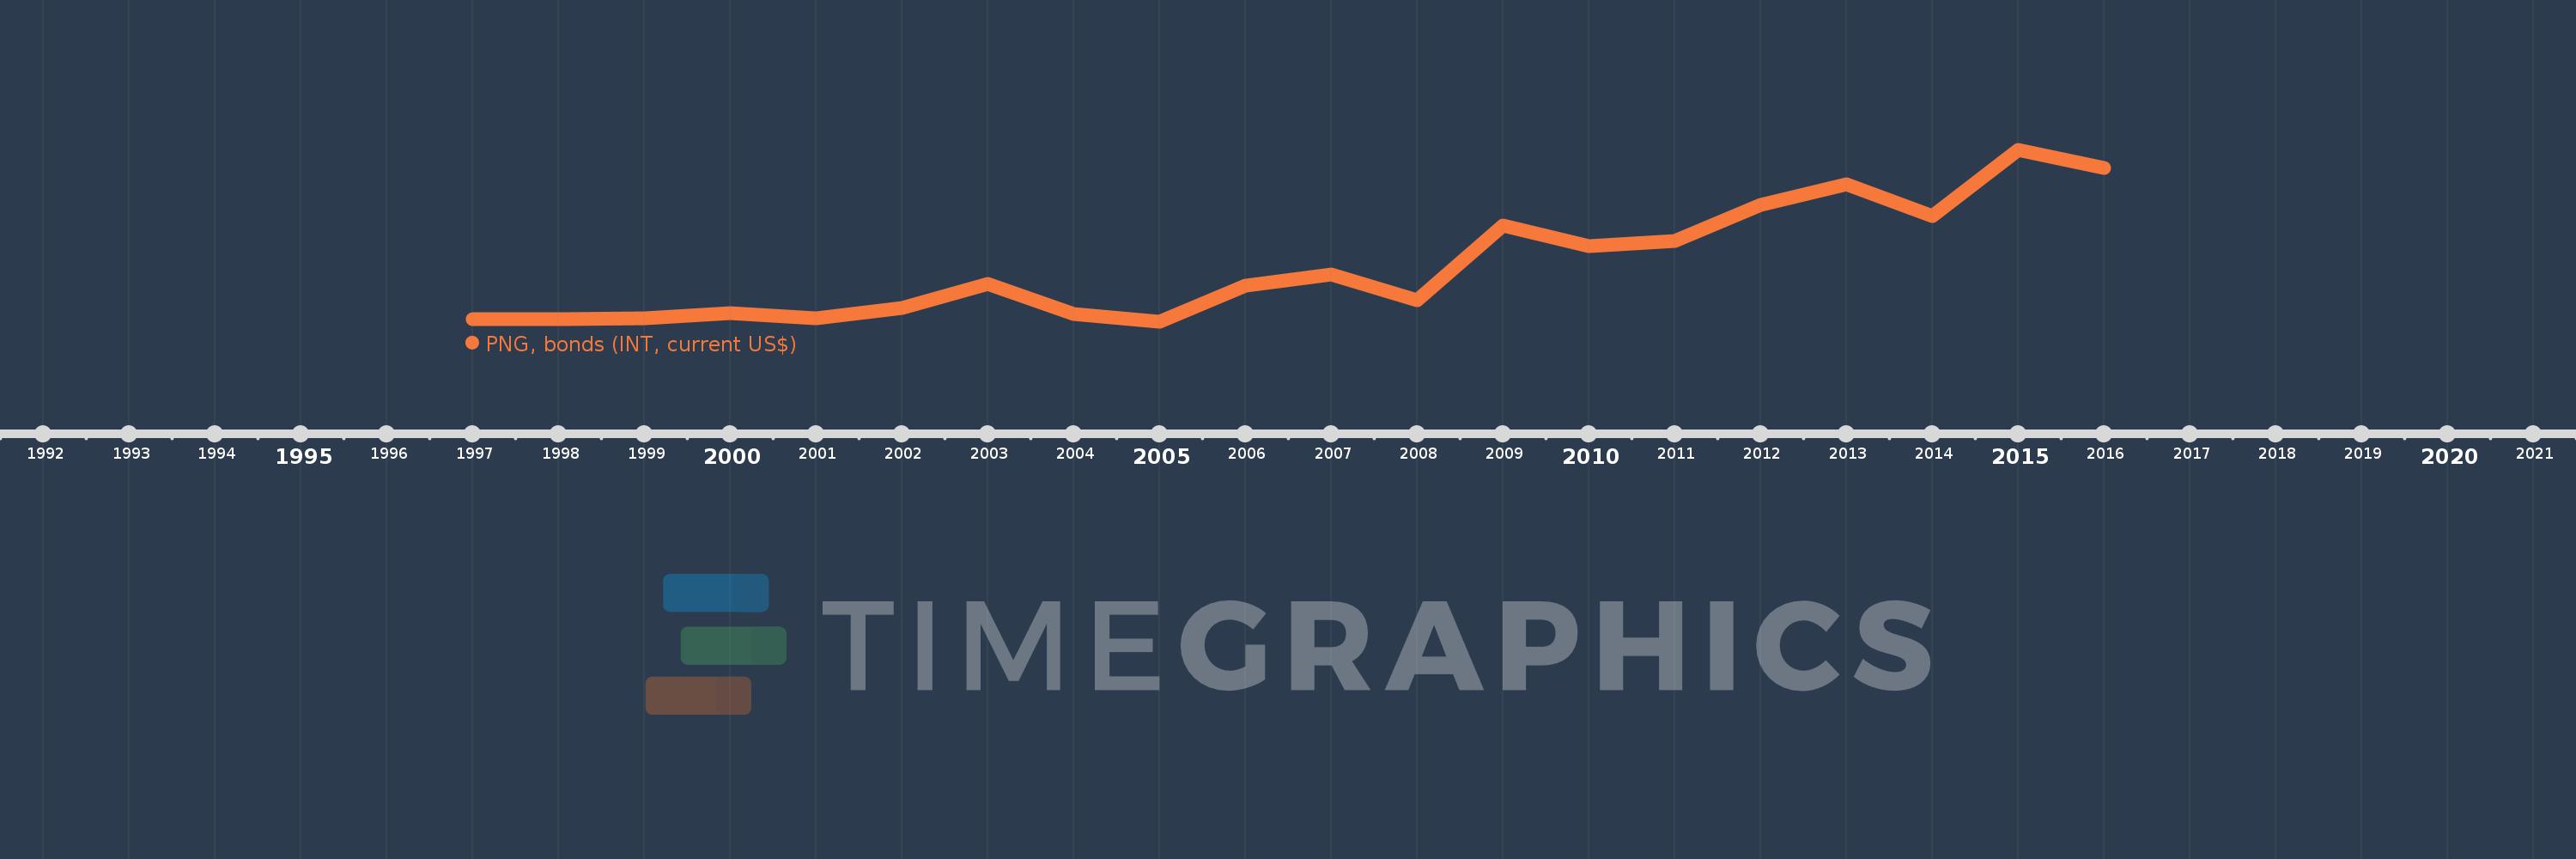
PNG, bonds (INT, current US$)
2016,2015,2014,2013,2012,2011,2010,2009,2008,2007,2006,2005,2004,2003,2002,2001,2000,1999,1998,1997
This statistics in other country:
Timeline:
This timeline shows a graph from 1997 to 2016 of South Africa. No data until 1996. Number of actual observations by date: 20.
Source name:
World Development Indicators
Source organization:
World Bank, International Debt Statistics.
Categories, topics:
External Debt
Last updated:
apr 23, 2017
Indicators value changes by year
Minimum:
8.455 mln
jan 1, 2005
Maximum:
968.454 mln
jan 1, 2015
At the date of observation
Value
Absolute change
Change from previous value
jan 1, 1997
24.5 mln
+24.5 mln
0.0%
jan 1, 1998
25.293 mln
+793.0K
3.24%
jan 1, 1999
27.148 mln
+1.855 mln
7.33%
jan 1, 2000
59.345 mln
+32.197 mln
118.6%
jan 1, 2001
27.148 mln
-32.197 mln
-54.25%
jan 1, 2002
84.398 mln
+57.25 mln
210.88%
jan 1, 2003
222.02 mln
+137.622 mln
163.06%
jan 1, 2004
54.584 mln
-167.436 mln
-75.41%
jan 1, 2005
8.455 mln
-46.129 mln
-84.51%
jan 1, 2006
211.641 mln
+203.186 mln
2.4K%
jan 1, 2007
272.1 mln
+60.459 mln
28.57%
jan 1, 2008
131.509 mln
-140.591 mln
-51.67%
jan 1, 2009
548.779 mln
+417.27 mln
317.29%
jan 1, 2010
432.46 mln
-116.319 mln
-21.2%
jan 1, 2011
459.709 mln
+27.249 mln
6.3%
jan 1, 2012
663.776 mln
+204.067 mln
44.39%
jan 1, 2013
776.266 mln
+112.49 mln
16.95%
jan 1, 2014
601.611 mln
-174.655 mln
-22.5%
jan 1, 2015
968.454 mln
+366.843 mln
60.98%
jan 1, 2016
869.087 mln
-99.367 mln
-10.26%
Ranking of countries by current statistics by years


Comments: