30
/
AIzaSyAYiBZKx7MnpbEhh9jyipgxe19OcubqV5w
April 1, 2024
196050
Mexico
MEX
true
2
1
PNG, bonds (INT, current US$)
2016,2015,2014,2013,2012,2011,2010,2009,2008,2007,2006,2005,2004,2003,2002,2001,2000,1999,1998,1997,1996,1995,1994,1993,1992
Public Timelines
FAQ
Menu
Public Timelines
FAQ
Public Timelines
FAQ
For education
For educational institutions
For teachers
For students
Open cabinet
For educational institutions
For teachers
For students
Open cabinet
Create
Close
Create a timeline
Public timelines
Library
FAQ
Download
Global statistics library
→
Mexico
→
PNG, bonds (INT, current US$)
This statistics in other country:
Argentina
Botswana
Brazil
Bulgaria
China
Colombia
Costa Rica
Dominican Republic
East Asia & Pacific (excluding high income)
Ecuador
Egypt, Arab Rep.
El Salvador
Europe & Central Asia (excluding high income)
Georgia
Ghana
Guatemala
IDA only
India
Indonesia
Jamaica
Kazakhstan
Lao PDR
Latin America & Caribbean (excluding high income)
Lebanon
Low & middle income
Lower middle income
Malaysia
Mexico
Middle East & North Africa (excluding high income)
Middle income
Mongolia
Nigeria
Pakistan
Panama
Paraguay
Peru
Philippines
Romania
Russian Federation
Serbia
South Africa
South Asia
Sri Lanka
Sub-Saharan Africa (excluding high income)
Thailand
Turkey
Ukraine
Upper middle income
Venezuela, RB
Vietnam
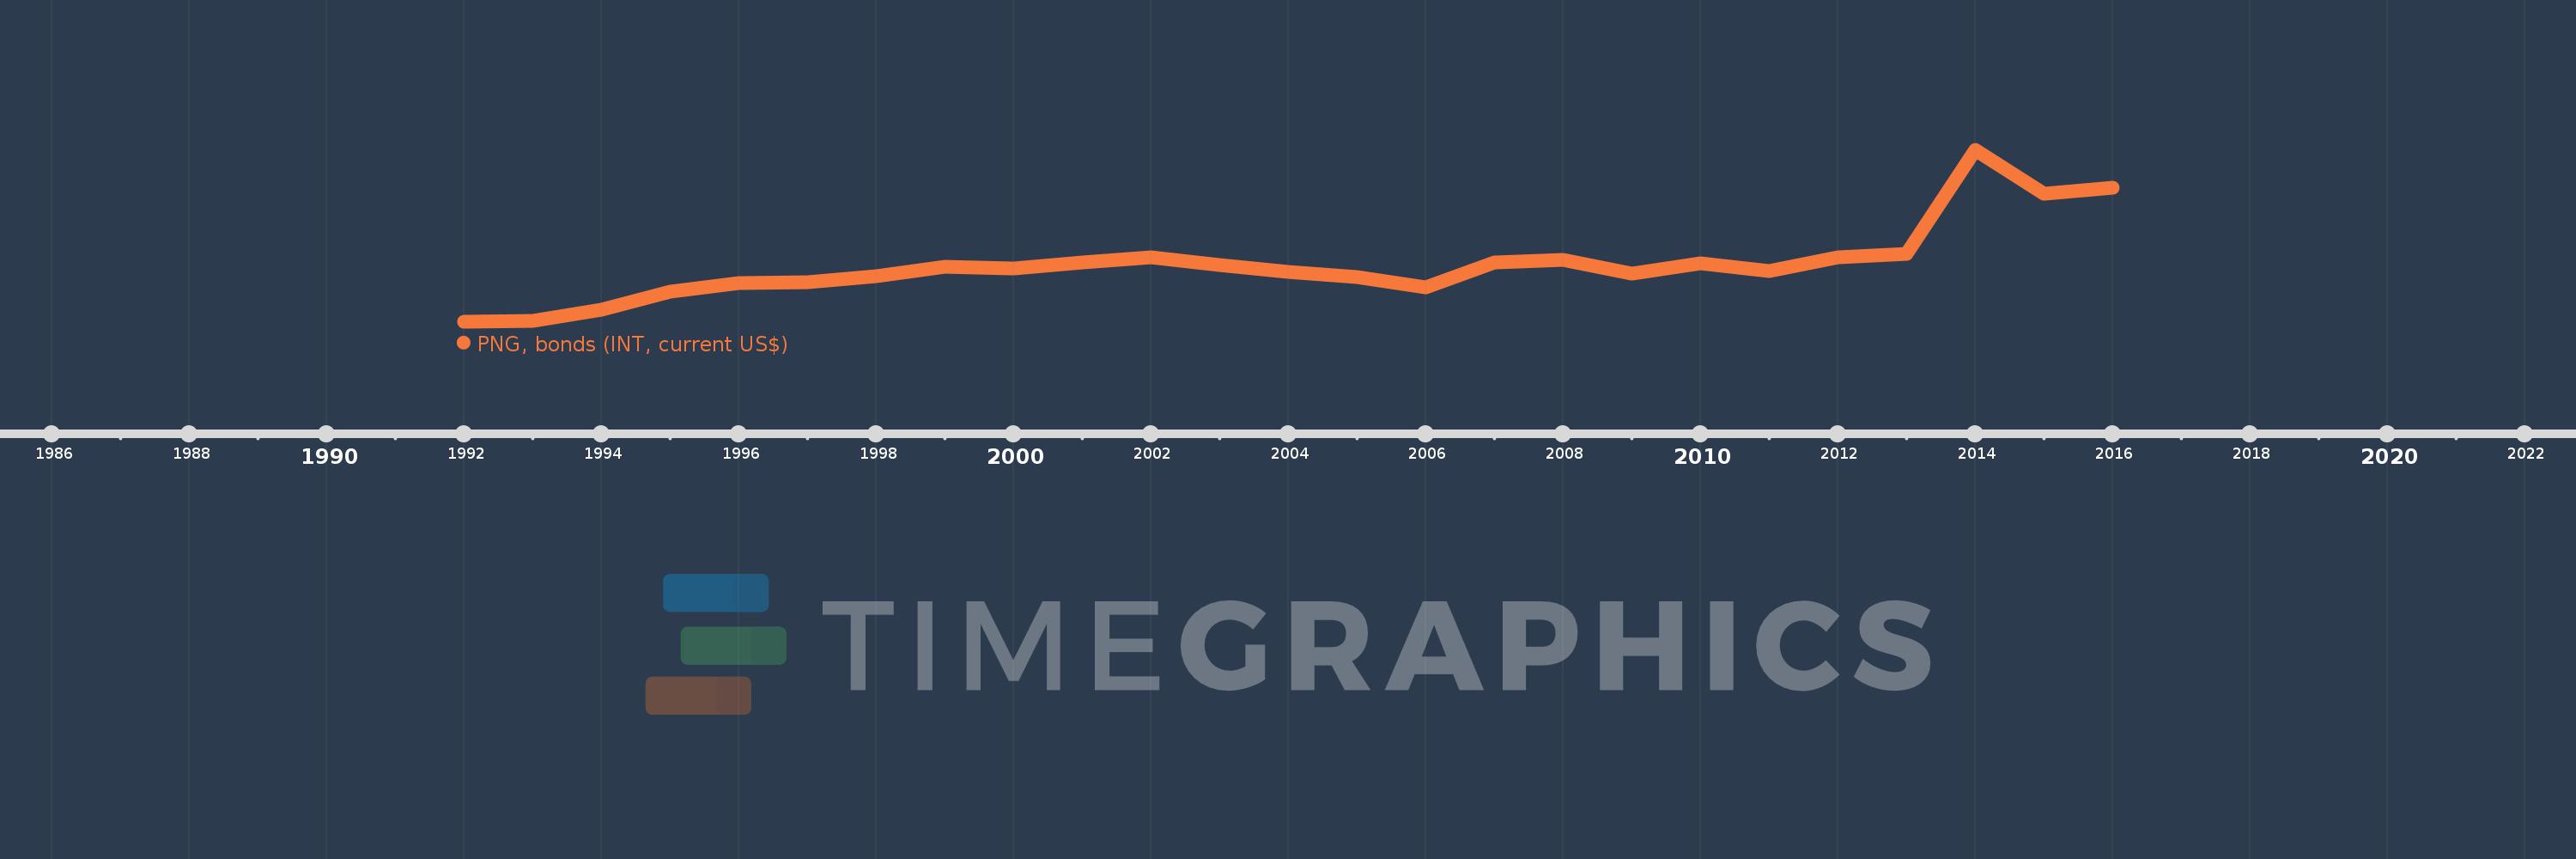
Timeline:
This timeline shows a graph from
1992
to
2016
of Mexico. No data until
1991
. Number of actual observations by date:
25
.
Source name:
World Development Indicators
Source organization:
World Bank, International Debt Statistics.
Categories, topics:
External Debt
Last updated:
apr 23, 2017
Indicators value changes by year
Meaning:
1.557 bln
Minimum:
27.912 mln
jan 1, 1992
Maximum:
4.606 bln
jan 1, 2014
At the date of observation
Value
Absolute change
Change from the previous value
jan 1, 1992
27.912 mln
+27.912 mln
0.0%
jan 1, 1993
64.128 mln
+36.216 mln
129.75%
jan 1, 1994
353.158 mln
+289.03 mln
450.71%
jan 1, 1995
825.769 mln
+472.611 mln
133.82%
jan 1, 1996
1.054 bln
+228.087 mln
27.62%
jan 1, 1997
1.096 bln
+42.19 mln
4.0%
jan 1, 1998
1.251 bln
+155.053 mln
14.15%
jan 1, 1999
1.494 bln
+242.634 mln
19.39%
jan 1, 2000
1.461 bln
-32.677 mln
-2.19%
jan 1, 2001
1.62 bln
+158.542 mln
10.85%
jan 1, 2002
1.752 bln
+132.485 mln
8.18%
jan 1, 2003
1.54 bln
-211.983 mln
-12.1%
jan 1, 2004
1.363 bln
-177.47 mln
-11.52%
jan 1, 2005
1.23 bln
-132.36 mln
-9.71%
jan 1, 2006
957.031 mln
-273.239 mln
-22.21%
jan 1, 2007
1.621 bln
+664.296 mln
69.41%
jan 1, 2008
1.694 bln
+72.673 mln
4.48%
jan 1, 2009
1.31 bln
-384.0 mln
-22.67%
jan 1, 2010
1.583 bln
+273.0 mln
20.84%
jan 1, 2011
1.379 bln
-204.0 mln
-12.89%
jan 1, 2012
1.761 bln
+381.63 mln
27.67%
jan 1, 2013
1.849 bln
+88.67 mln
5.04%
jan 1, 2014
4.606 bln
+2.756 bln
149.04%
jan 1, 2015
3.446 bln
-1.16 bln
-25.18%
jan 1, 2016
3.596 bln
+150.197 mln
4.36%
Ranking of countries by current statistics by years
About & Feedback
Terms
Privacy
Library
2024
©
Time.Graphics
Support 24/7
Cabinet
Get premium
Donate
The service accepts bank transfer (ACH, Wire) or cards (Visa, MasterCard, etc). Processed by Stripe.
Secured with SSL
Excellent (Trustpilot Reviews)
Based on 115+ reviews
Write your own review on
Trustpilot.com
