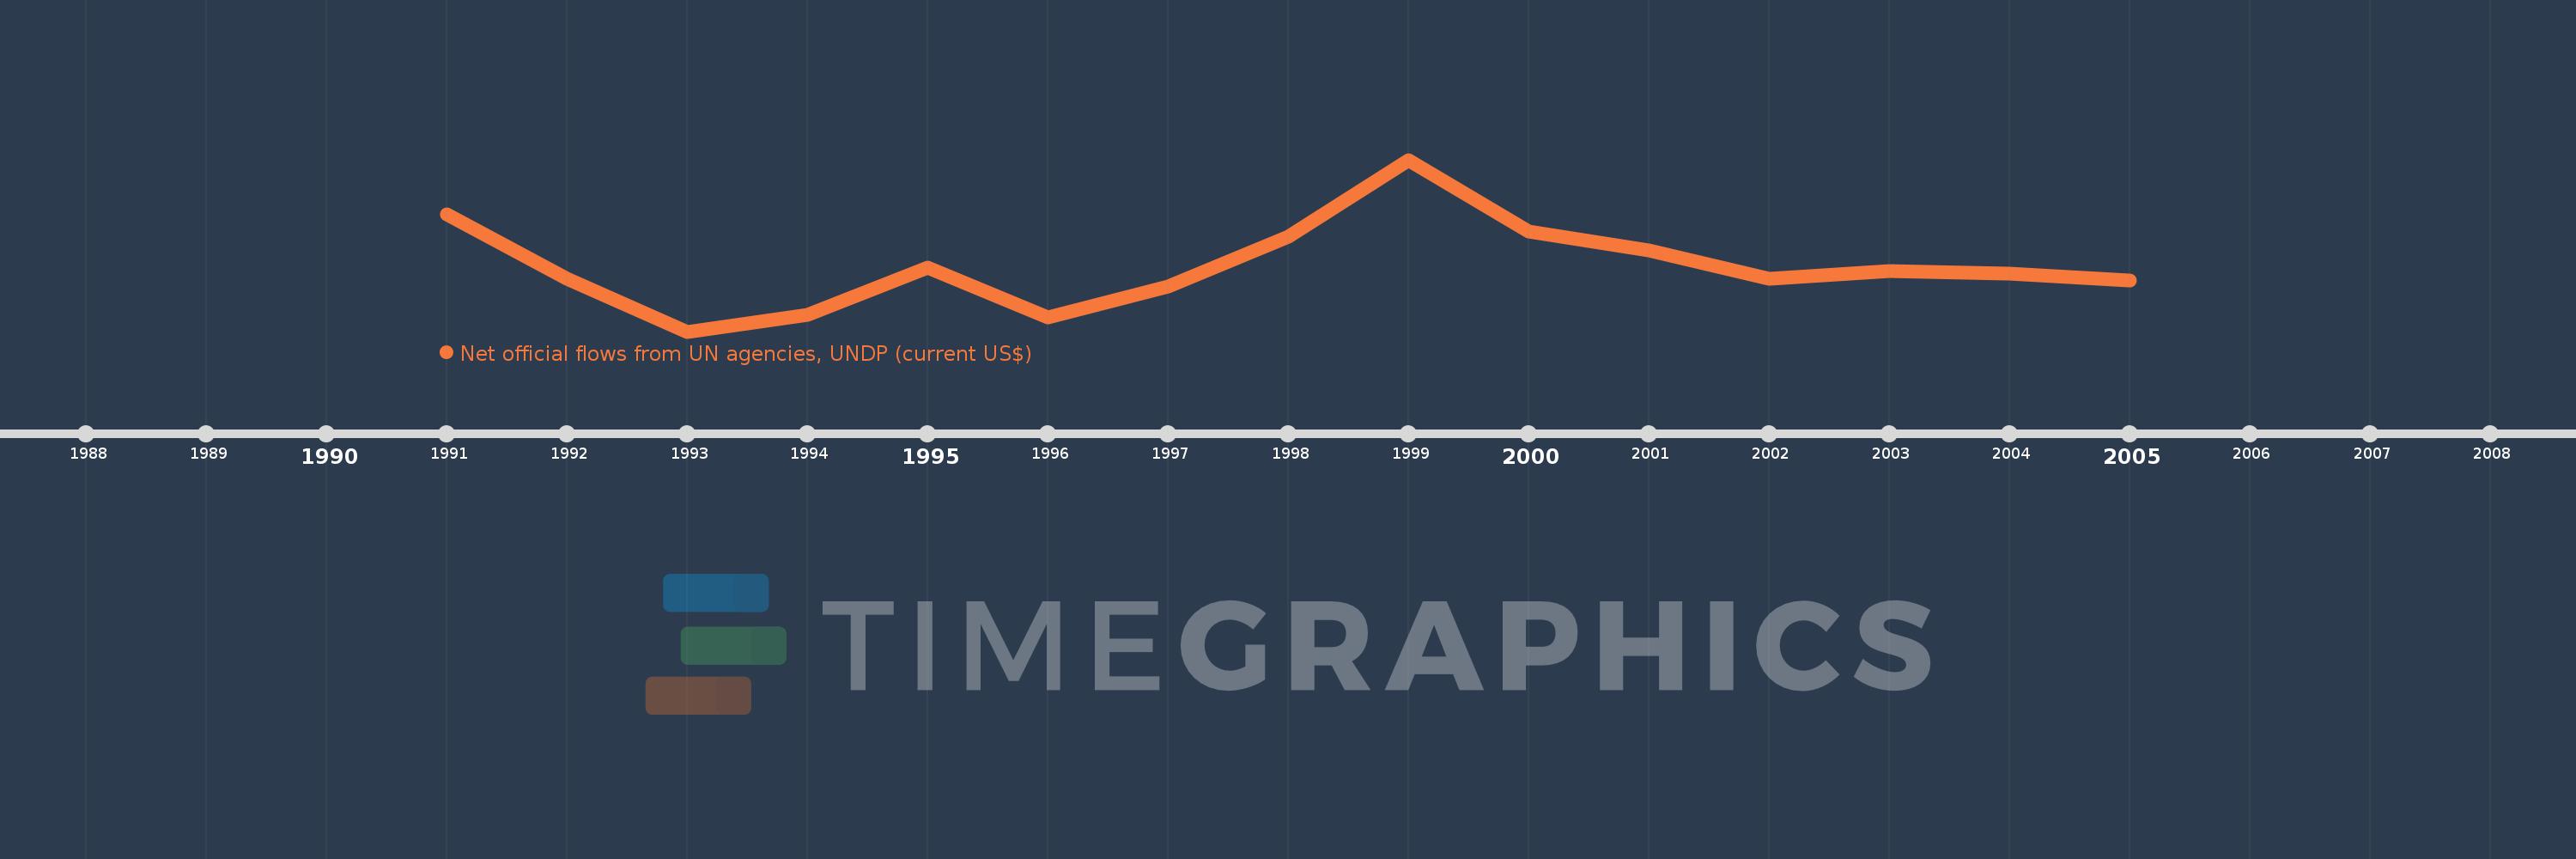
This timeline shows a graph from 1991 to 2005 of Bulgaria. No data until 1990. Number of actual observations by date: 15.
Source name:
World Development Indicators
Source organization:
Development Assistance Committee of the Organisation for Economic Co-operation and Development, Geographical Distribution of Financial Flows to Developing Countries, Development Co-operation Report, and International Development Statistics database. Data are available online at: www.oecd.org/dac/stats/idsonline.
Categories, topics:
Aid Effectiveness
Last updated:
apr 23, 2017
Indicators value changes by year
Meaning:
729.333K
Minimum:
310.0K
jan 1, 1993
Maximum:
1.41 mln
jan 1, 1999
At the date of observation
Value
Absolute change
Change from the previous value
jan 1, 1991
1.06 mln
+1.06 mln
0.0%
jan 1, 1992
650.0K
-410.0K
-38.68%
jan 1, 1993
310.0K
-340.0K
-52.31%
jan 1, 1994
420.0K
+110.0K
35.48%
jan 1, 1995
720.0K
+300.0K
71.43%
jan 1, 1996
400.0K
-320.0K
-44.44%
jan 1, 1997
600.0K
+200.0K
50.0%
jan 1, 1998
920.0K
+320.0K
53.33%
jan 1, 1999
1.41 mln
+490.0K
53.26%
jan 1, 2000
950.0K
-460.0K
-32.62%
jan 1, 2001
830.0K
-120.0K
-12.63%
jan 1, 2002
650.0K
-180.0K
-21.69%
jan 1, 2003
700.0K
+50.0K
7.69%
jan 1, 2004
680.0K
-20.0K
-2.86%
jan 1, 2005
640.0K
-40.0K
-5.88%
Ranking of countries by current statistics by years
