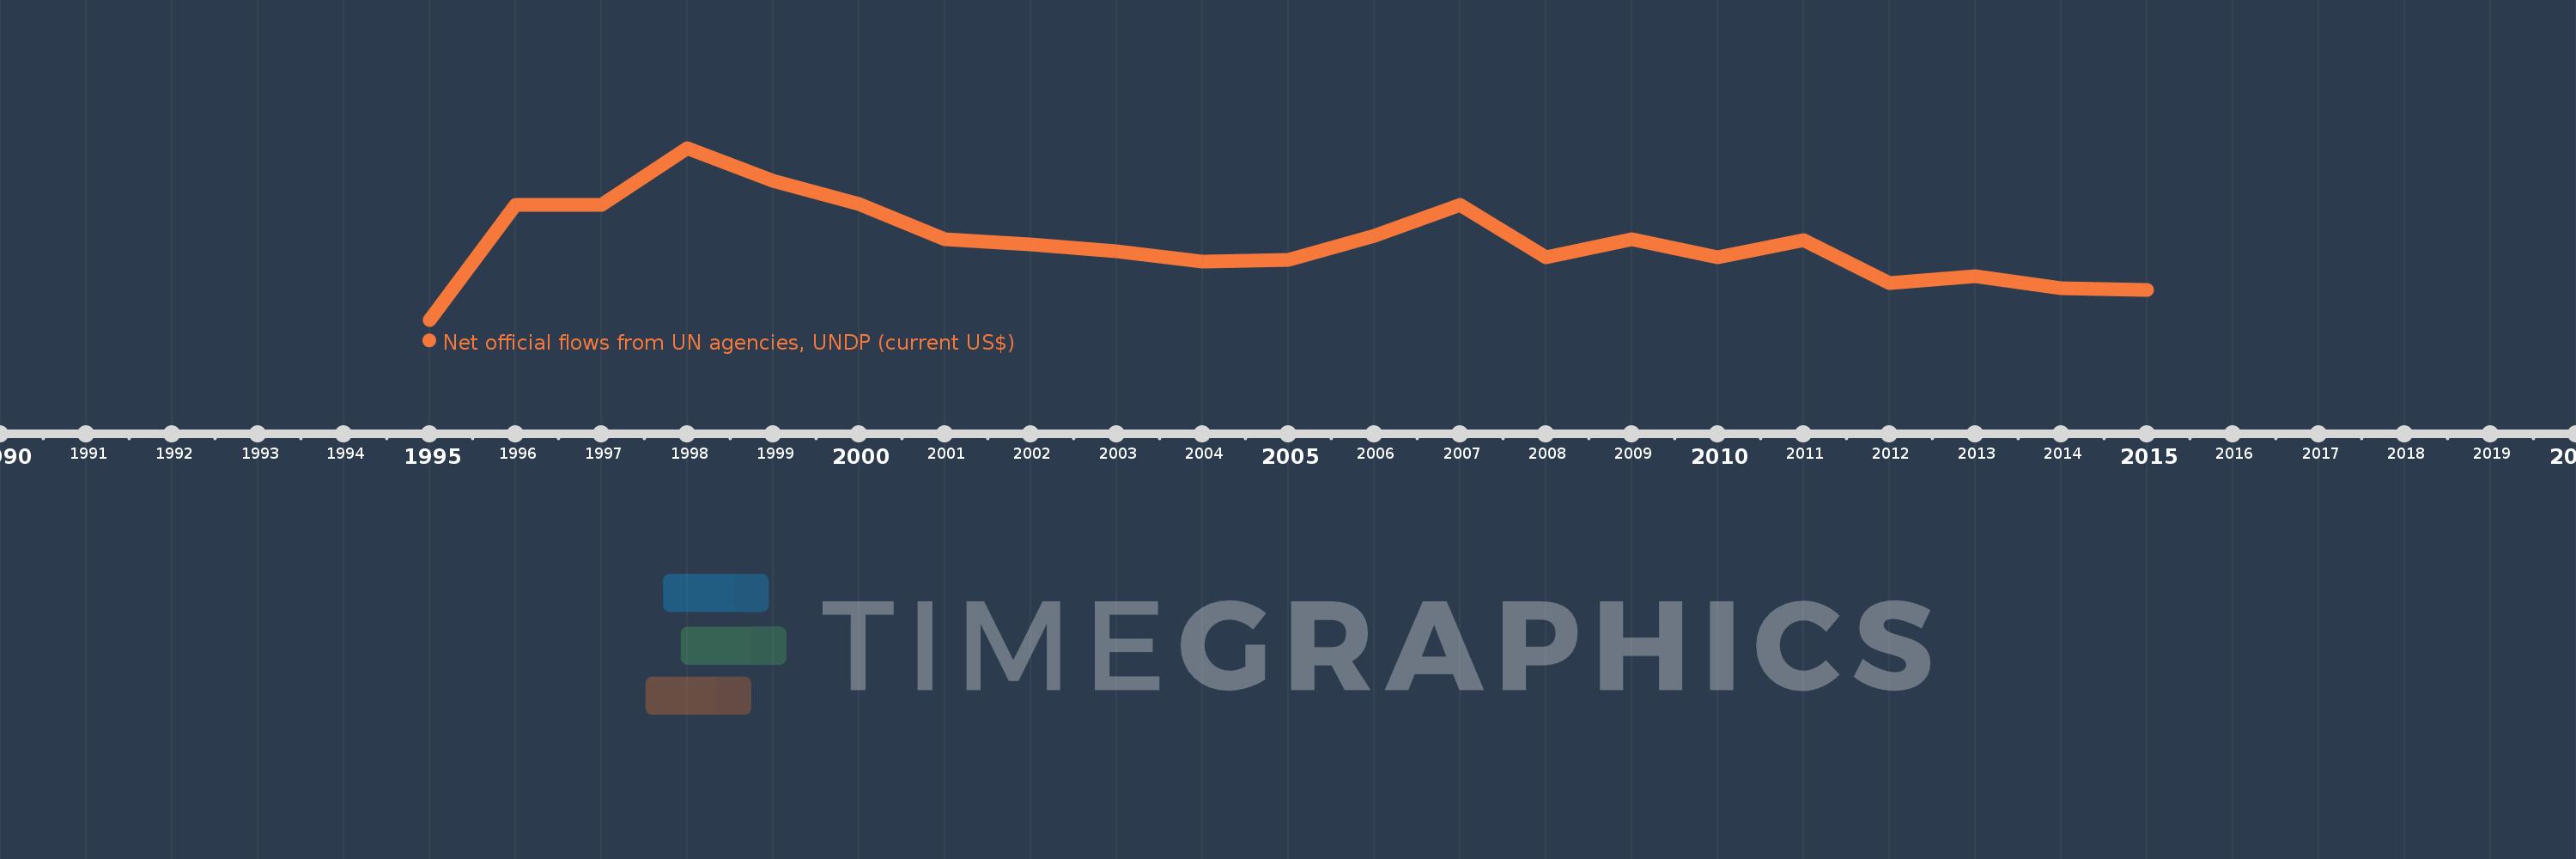
This timeline shows a graph from 1995 to 2015 of Kazakhstan. No data until 1994. Number of actual observations by date: 21.
Source name:
World Development Indicators
Source organization:
Development Assistance Committee of the Organisation for Economic Co-operation and Development, Geographical Distribution of Financial Flows to Developing Countries, Development Co-operation Report, and International Development Statistics database. Data are available online at: www.oecd.org/dac/stats/idsonline.
Categories, topics:
Aid Effectiveness
Last updated:
apr 23, 2017
Indicators value changes by year
Meaning:
810.0K
Minimum:
130.0K
jan 1, 1995
Maximum:
1.64 mln
jan 1, 1998
At the date of observation
Value
Absolute change
Change from the previous value
jan 1, 1995
130.0K
+130.0K
0.0%
jan 1, 1996
1.14 mln
+1.01 mln
776.92%
jan 1, 1997
1.14 mln
0.0
0.0%
jan 1, 1998
1.64 mln
+500.0K
43.86%
jan 1, 1999
1.35 mln
-290.0K
-17.68%
jan 1, 2000
1.15 mln
-200.0K
-14.81%
jan 1, 2001
840.0K
-310.0K
-26.96%
jan 1, 2002
790.0K
-50.0K
-5.95%
jan 1, 2003
730.0K
-60.0K
-7.59%
jan 1, 2004
640.0K
-90.0K
-12.33%
jan 1, 2005
660.0K
+20.0K
3.13%
jan 1, 2006
870.0K
+210.0K
31.82%
jan 1, 2007
1.14 mln
+270.0K
31.03%
jan 1, 2008
680.0K
-460.0K
-40.35%
jan 1, 2009
840.0K
+160.0K
23.53%
jan 1, 2010
680.0K
-160.0K
-19.05%
jan 1, 2011
830.0K
+150.0K
22.06%
jan 1, 2012
450.0K
-380.0K
-45.78%
jan 1, 2013
510.0K
+60.0K
13.33%
jan 1, 2014
410.0K
-100.0K
-19.61%
jan 1, 2015
390.0K
-20.0K
-4.88%
Ranking of countries by current statistics by years
