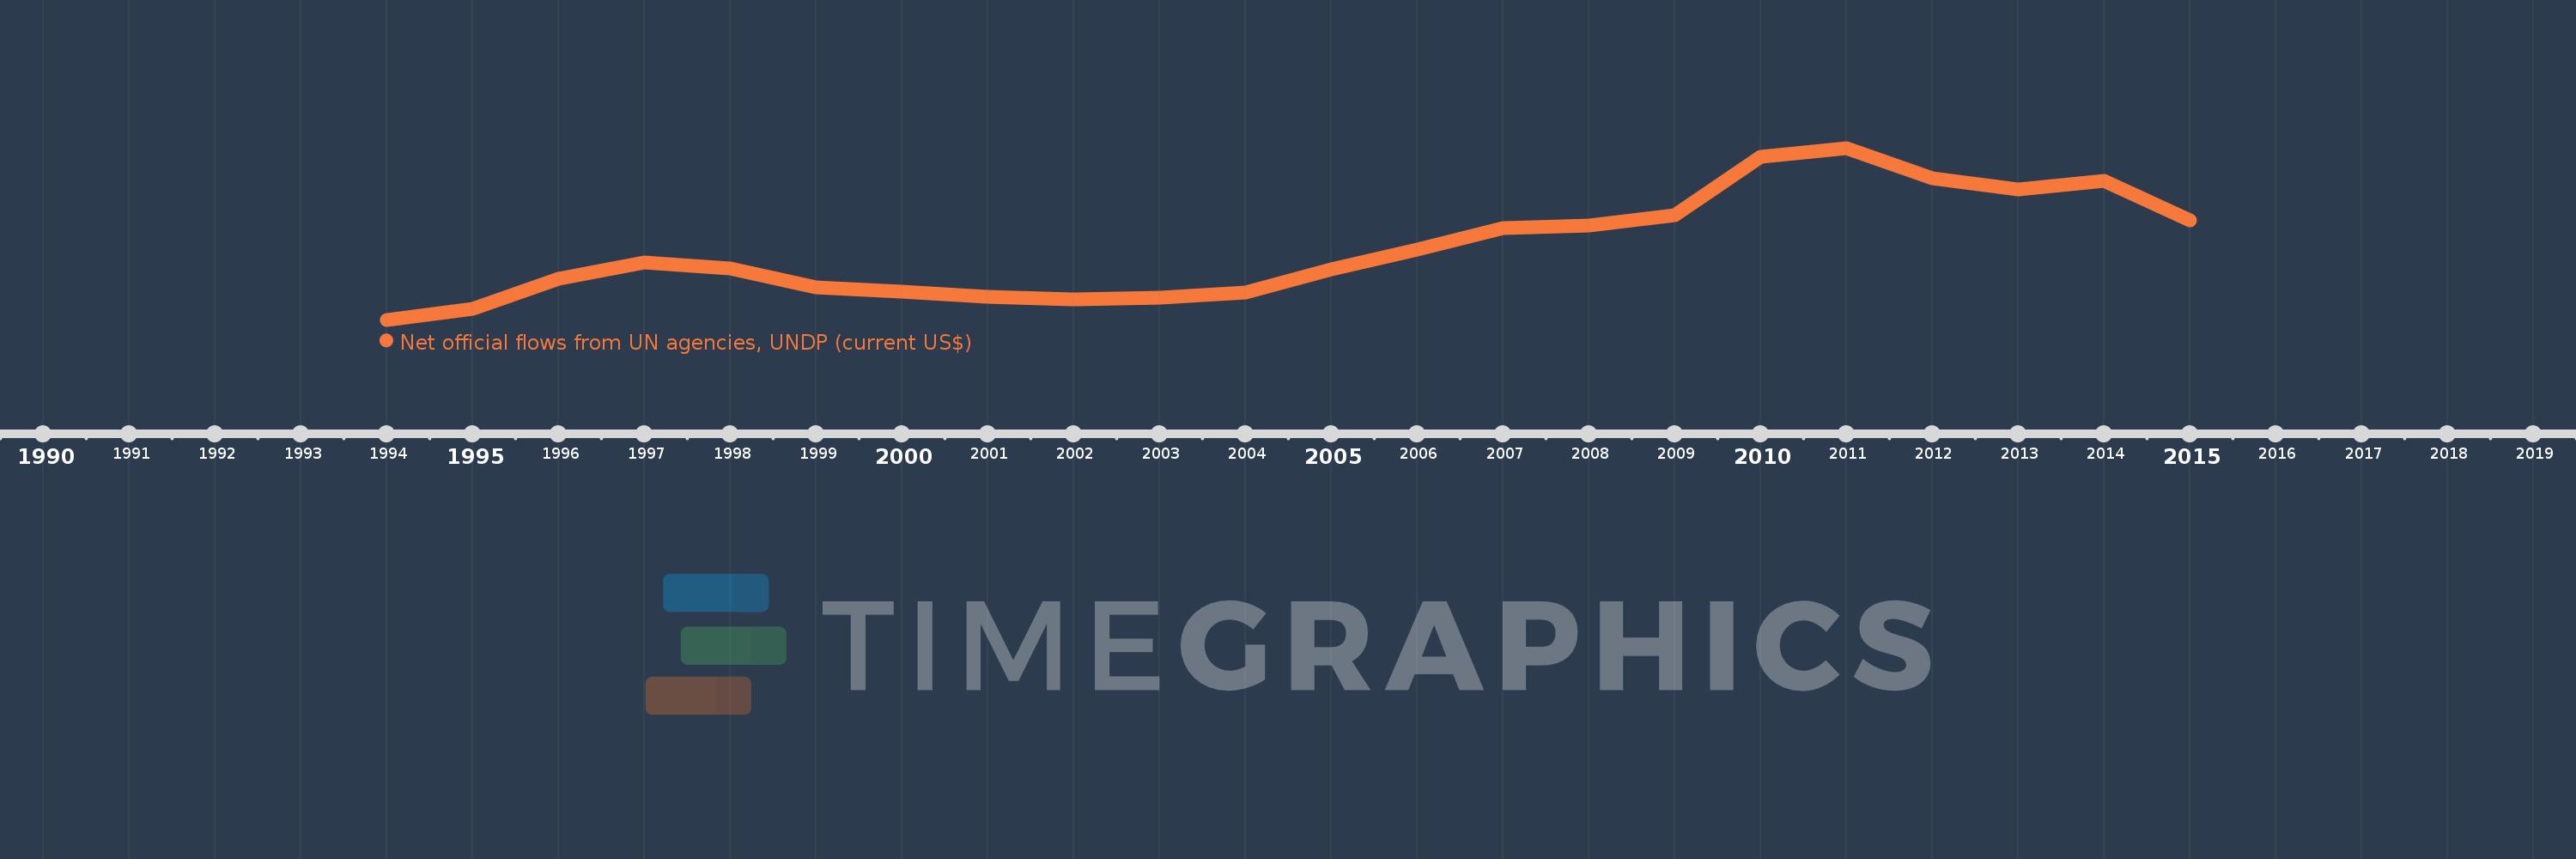
This timeline shows a graph from 1994 to 2015 of Uzbekistan. No data until 1993. Number of actual observations by date: 22.
Source name:
World Development Indicators
Source organization:
Development Assistance Committee of the Organisation for Economic Co-operation and Development, Geographical Distribution of Financial Flows to Developing Countries, Development Co-operation Report, and International Development Statistics database. Data are available online at: www.oecd.org/dac/stats/idsonline.
Categories, topics:
Aid Effectiveness
Last updated:
apr 23, 2017
Indicators value changes by year
Meaning:
3.1 mln
Minimum:
410.0K
jan 1, 1994
Maximum:
6.89 mln
jan 1, 2011
At the date of observation
Value
Absolute change
Change from the previous value
jan 1, 1994
410.0K
+410.0K
0.0%
jan 1, 1995
810.0K
+400.0K
97.56%
jan 1, 1996
1.95 mln
+1.14 mln
140.74%
jan 1, 1997
2.56 mln
+610.0K
31.28%
jan 1, 1998
2.35 mln
-210.0K
-8.2%
jan 1, 1999
1.63 mln
-720.0K
-30.64%
jan 1, 2000
1.46 mln
-170.0K
-10.43%
jan 1, 2001
1.28 mln
-180.0K
-12.33%
jan 1, 2002
1.18 mln
-100.0K
-7.81%
jan 1, 2003
1.24 mln
+60.0K
5.08%
jan 1, 2004
1.44 mln
+200.0K
16.13%
jan 1, 2005
2.32 mln
+880.0K
61.11%
jan 1, 2006
3.05 mln
+730.0K
31.47%
jan 1, 2007
3.86 mln
+810.0K
26.56%
jan 1, 2008
3.98 mln
+120.0K
3.11%
jan 1, 2009
4.35 mln
+370.0K
9.3%
jan 1, 2010
6.57 mln
+2.22 mln
51.03%
jan 1, 2011
6.89 mln
+320.0K
4.87%
jan 1, 2012
5.74 mln
-1.15 mln
-16.69%
jan 1, 2013
5.31 mln
-430.0K
-7.49%
jan 1, 2014
5.64 mln
+330.0K
6.21%
jan 1, 2015
4.17 mln
-1.47 mln
-26.06%
Ranking of countries by current statistics by years
