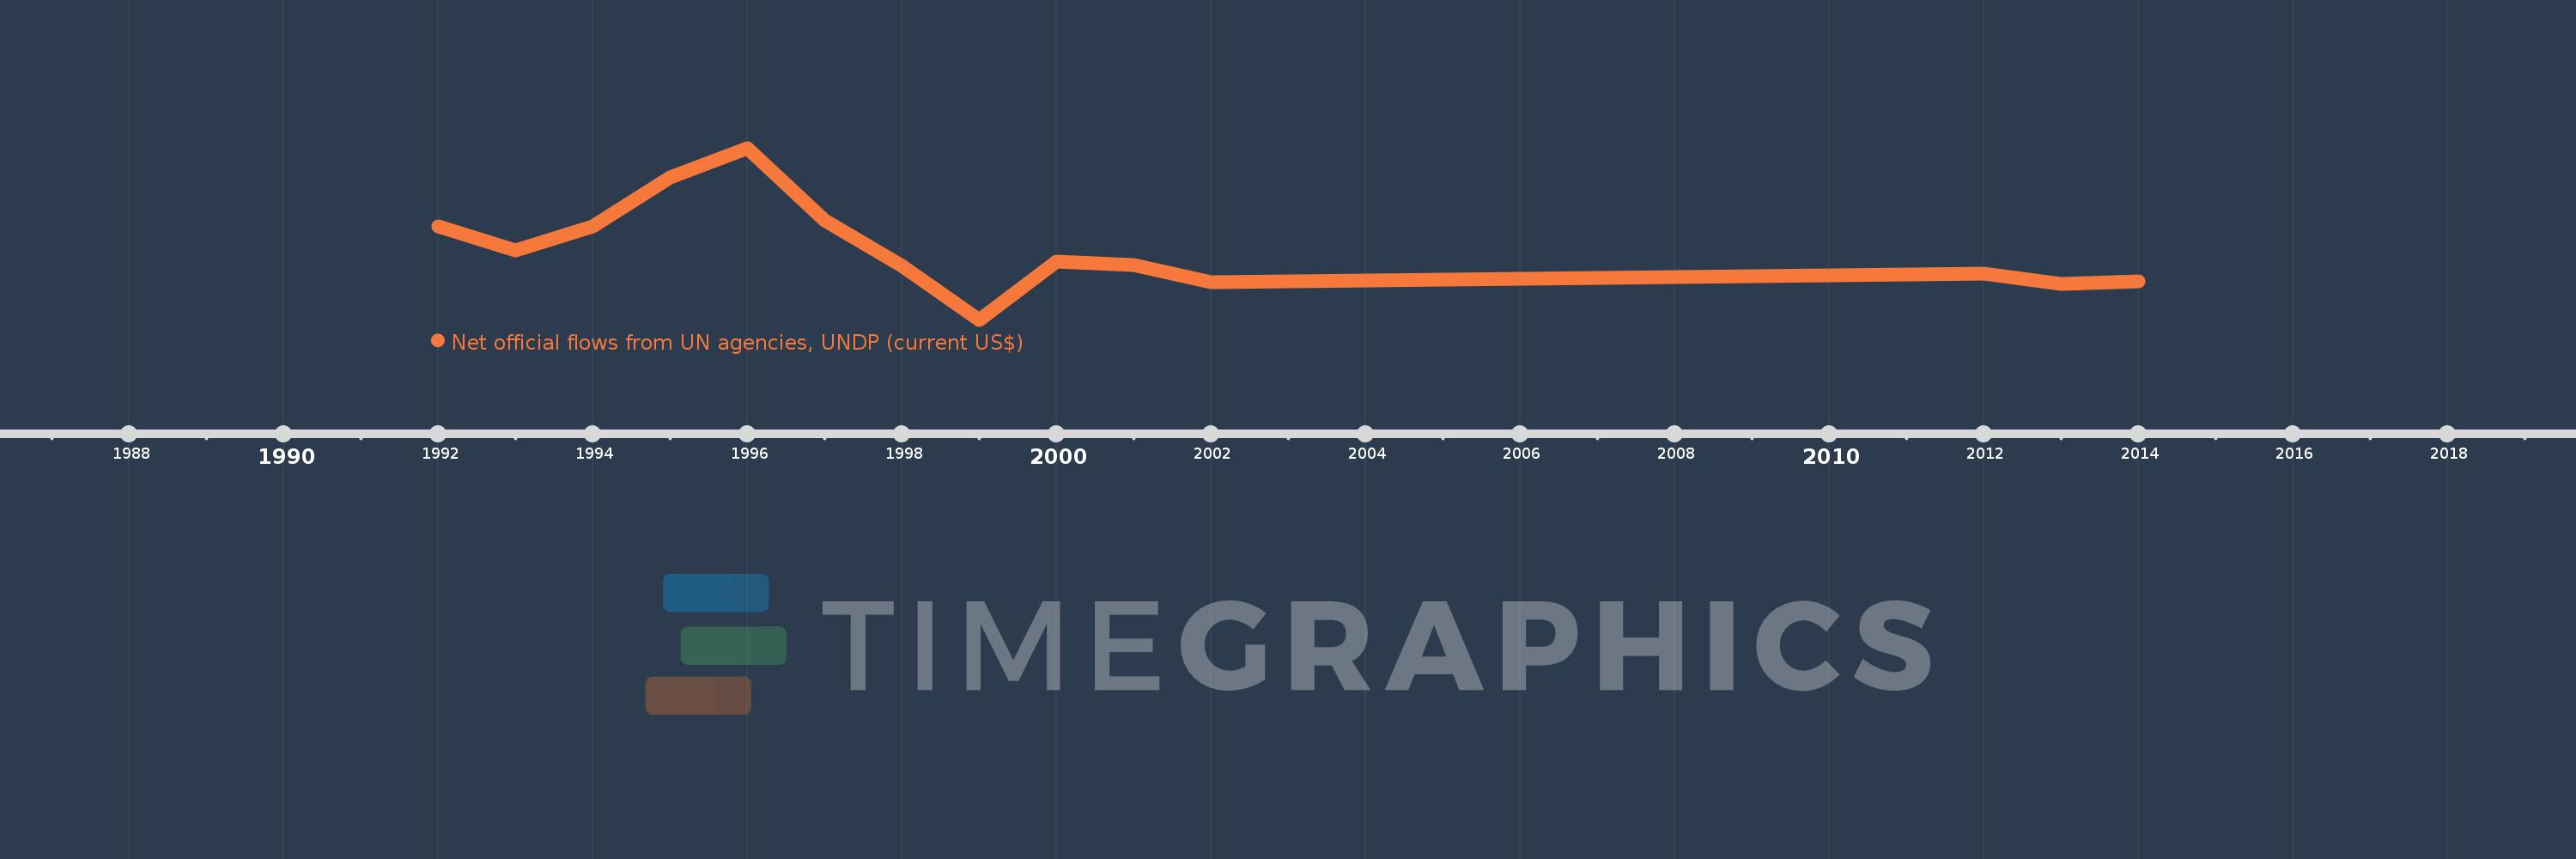
This timeline shows a graph from 1992 to 2014 of Micronesia, Fed. Sts.. No data until 1991. Number of actual observations by date: 15.
Source name:
World Development Indicators
Source organization:
Development Assistance Committee of the Organisation for Economic Co-operation and Development, Geographical Distribution of Financial Flows to Developing Countries, Development Co-operation Report, and International Development Statistics database. Data are available online at: www.oecd.org/dac/stats/idsonline.
Categories, topics:
Aid Effectiveness
Last updated:
apr 23, 2017
Indicators value changes by year
Meaning:
263.333K
Minimum:
-290.0K
jan 1, 1999
Maximum:
1.09 mln
jan 1, 1996
At the date of observation
Value
Absolute change
Change from the previous value
jan 1, 1992
460.0K
+460.0K
0.0%
jan 1, 1993
270.0K
-190.0K
-41.3%
jan 1, 1994
460.0K
+190.0K
70.37%
jan 1, 1995
850.0K
+390.0K
84.78%
jan 1, 1996
1.09 mln
+240.0K
28.24%
jan 1, 1997
510.0K
-580.0K
-53.21%
jan 1, 1998
140.0K
-370.0K
-72.55%
jan 1, 1999
-290.0K
-430.0K
-307.14%
jan 1, 2000
180.0K
+470.0K
-162.07%
jan 1, 2001
150.0K
-30.0K
-16.67%
jan 1, 2002
10.0K
-140.0K
-93.33%
jan 1, 2003
20.0K
+10.0K
100.0%
jan 1, 2012
80.0K
+60.0K
300.0%
jan 1, 2013
0.0
-80.0K
-100.0%
jan 1, 2014
20.0K
+20.0K
%
Ranking of countries by current statistics by years
