29
/
en
AIzaSyAYiBZKx7MnpbEhh9jyipgxe19OcubqV5w
April 1, 2024
91487
Brazil
BRA
true
2
1
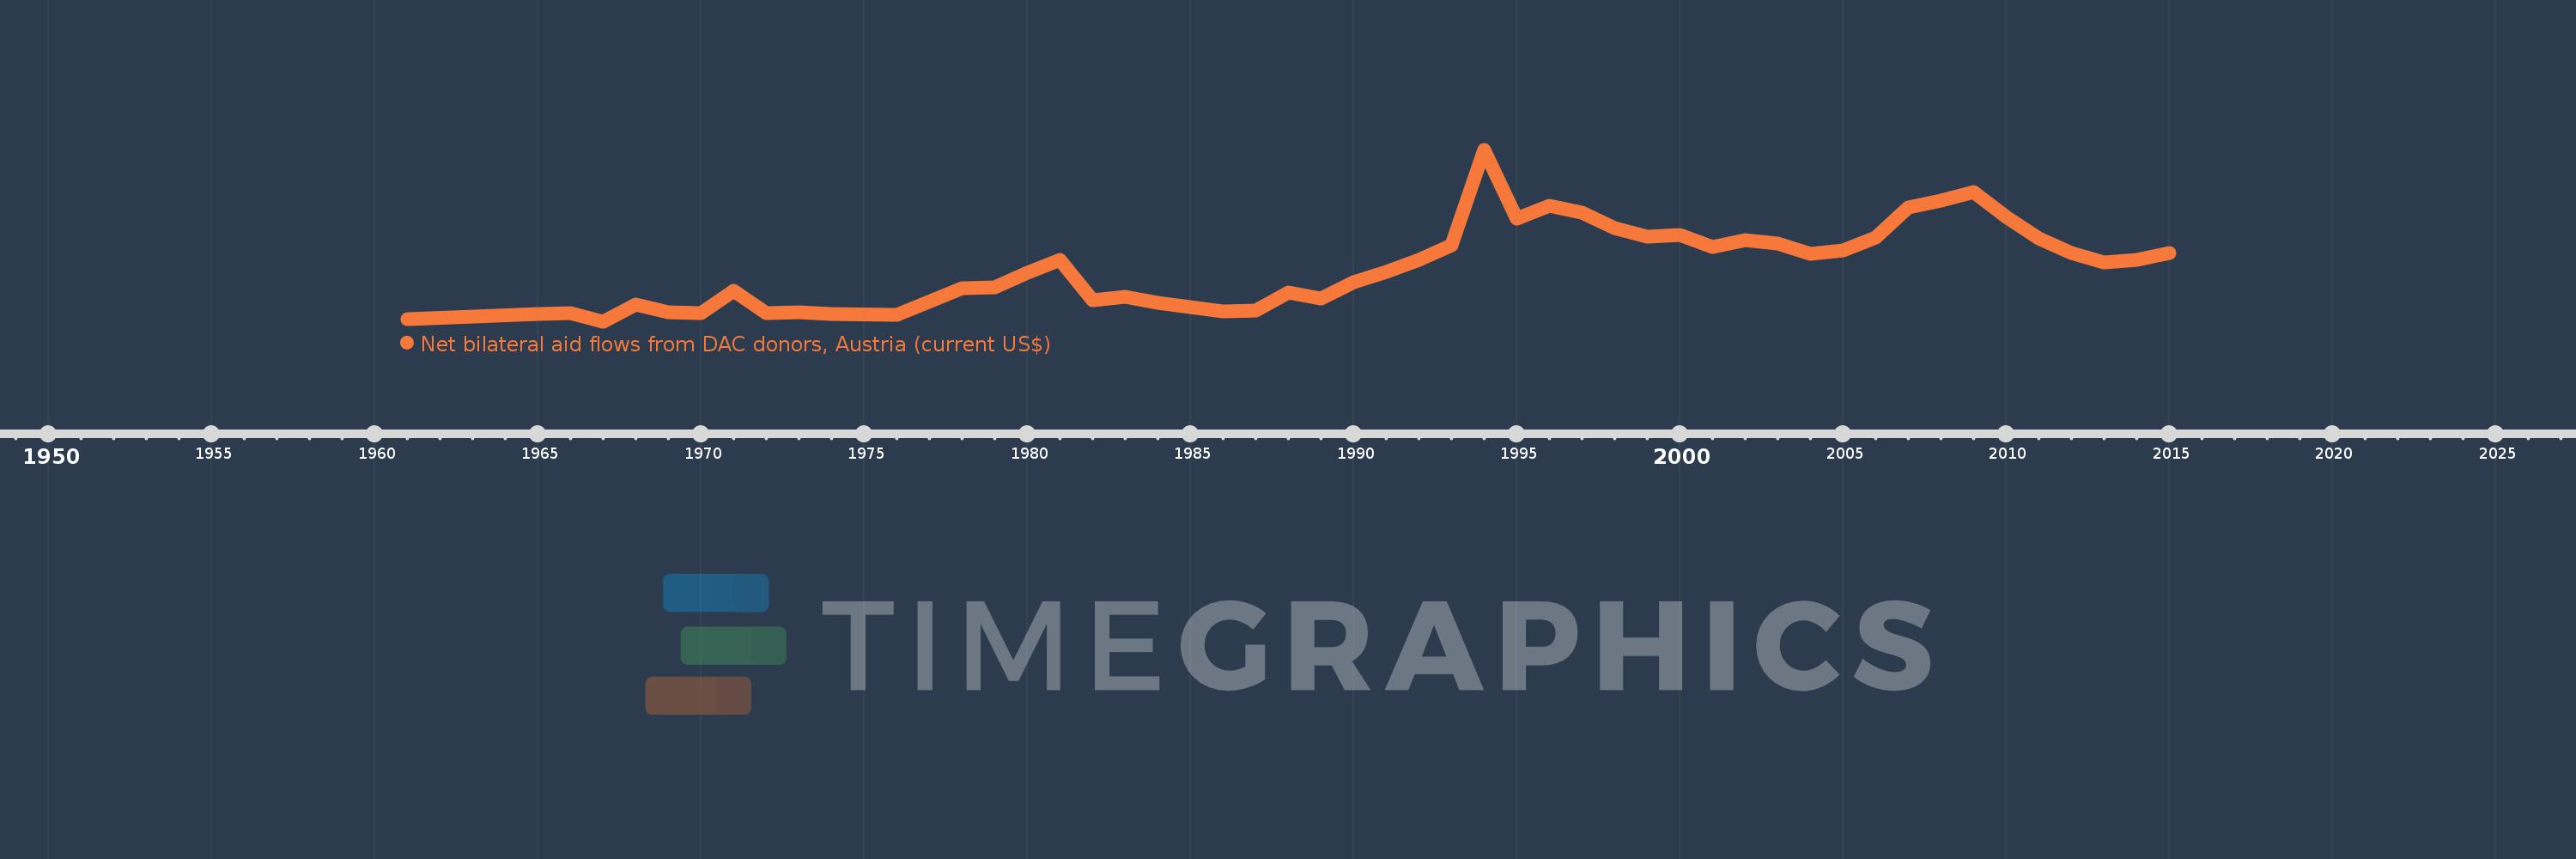
Net bilateral aid flows from DAC donors, Austria (current US$)
2015,2014,2013,2012,2011,2010,2009,2008,2007,2006,2005,2004,2003,2002,2001,2000,1999,1998,1997,1996,1995,1994,1993,1992,1991,1990,1989,1988,1987,1986,1985,1984,1983,1982,1981,1980,1979,1978,1976,1974,1973,1972,1971,1970,1969,1968,1967,1966,1965,1961
This statistics in other country:
AfghanistanAlbaniaAlgeriaAngolaAntigua and BarbudaArab WorldArgentinaArmeniaAzerbaijanBahamas, TheBahrainBangladeshBarbadosBelarusBelizeBeninBhutanBoliviaBosnia and HerzegovinaBotswanaBrazilBulgariaBurkina FasoBurundiCabo VerdeCambodiaCameroonCaribbean small statesCentral African RepublicCentral Europe and the BalticsChadChileChinaColombiaComorosCongo, Dem. Rep.Congo, Rep.Costa RicaCote d'IvoireCroatiaCubaCyprusCzech RepublicDjiboutiDominicaDominican RepublicEast Asia & PacificEast Asia & Pacific (excluding high income)East Asia & Pacific (IDA & IBRD countries)EcuadorEgypt, Arab Rep.El SalvadorEquatorial GuineaEritreaEstoniaEthiopiaEuro areaEurope & Central AsiaEurope & Central Asia (excluding high income)Europe & Central Asia (IDA & IBRD countries)European UnionFijiFragile and conflict affected situationsFrench PolynesiaGabonGambia, TheGeorgiaGhanaGrenadaGuatemalaGuineaGuinea-BissauGuyanaHaitiHeavily indebted poor countries (HIPC)High incomeHondurasHong Kong SAR, ChinaHungaryIBRD onlyIDA & IBRD totalIDA blendIDA onlyIDA totalIndiaIndonesiaIran, Islamic Rep.IraqIsraelJamaicaJordanKazakhstanKenyaKorea, Dem. People’s Rep.Korea, Rep.KosovoKuwaitKyrgyz RepublicLao PDRLatin America & Caribbean Latin America & Caribbean (excluding high income)Latin America & the Caribbean (IDA & IBRD countries)LatviaLeast developed countries: UN classificationLebanonLesothoLiberiaLibyaLithuaniaLow & middle incomeLow incomeLower middle incomeMacedonia, FYRMadagascarMalawiMalaysiaMaldivesMaliMaltaMauritaniaMauritiusMexicoMiddle East & North AfricaMiddle East & North Africa (excluding high income)Middle East & North Africa (IDA & IBRD countries)Middle incomeMoldovaMongoliaMontenegroMoroccoMozambiqueMyanmarNamibiaNepalNicaraguaNigerNigeriaOECD membersOmanOther small statesPacific island small statesPakistanPalauPanamaPapua New GuineaParaguayPeruPhilippinesPolandQatarRomaniaRussian FederationRwandaSamoaSao Tome and PrincipeSaudi ArabiaSenegalSerbiaSeychellesSierra LeoneSingaporeSlovak RepublicSloveniaSmall statesSolomon IslandsSomaliaSouth AfricaSouth AsiaSouth Asia (IDA & IBRD)South SudanSri LankaSt. Kitts and NevisSt. LuciaSt. Vincent and the GrenadinesSub-Saharan Africa Sub-Saharan Africa (excluding high income)Sub-Saharan Africa (IDA & IBRD countries)SudanSurinameSwazilandSyrian Arab RepublicTajikistanTanzaniaThailandTimor-LesteTogoTrinidad and TobagoTunisiaTurkeyTurkmenistanUgandaUkraineUnited Arab EmiratesUpper middle incomeUruguayUzbekistanVanuatuVenezuela, RBVietnamWest Bank and GazaWorldYemen, Rep.ZambiaZimbabwe Timeline:
This timeline shows a graph from 1961 to 2015 of Brazil. No data until 1960. Number of actual observations by date: 50.
Source name:
World Development Indicators
Source organization:
Development Assistance Committee of the Organisation for Economic Co-operation and Development, Geographical Distribution of Financial Flows to Developing Countries, Development Co-operation Report, and International Development Statistics database. Data are available online at: www.oecd.org/dac/stats/idsonline.
Categories, topics:
Aid Effectiveness
Last updated:
apr 23, 2017
Indicators value changes by year
Minimum:
-200.0K
jan 1, 1967
Maximum:
4.24 mln
jan 1, 1994
At the date of observation
Value
Absolute change
Change from previous value
jan 1, 1961
-130.0K
-130.0K
0.0%
jan 1, 1965
10.0K
+140.0K
-107.69%
jan 1, 1966
30.0K
+20.0K
200.0%
jan 1, 1967
-200.0K
-230.0K
-766.67%
jan 1, 1968
260.0K
+460.0K
-230.0%
jan 1, 1969
40.0K
-220.0K
-84.62%
jan 1, 1970
20.0K
-20.0K
-50.0%
jan 1, 1971
610.0K
+590.0K
2.95K%
jan 1, 1972
30.0K
-580.0K
-95.08%
jan 1, 1973
50.0K
+20.0K
66.67%
jan 1, 1974
10.0K
-40.0K
-80.0%
jan 1, 1976
-20.0K
-30.0K
-300.0%
jan 1, 1978
680.0K
+700.0K
-3.5K%
jan 1, 1979
690.0K
+10.0K
1.47%
jan 1, 1980
1.07 mln
+380.0K
55.07%
jan 1, 1981
1.4 mln
+330.0K
30.84%
jan 1, 1982
360.0K
-1.04 mln
-74.29%
jan 1, 1983
440.0K
+80.0K
22.22%
jan 1, 1984
300.0K
-140.0K
-31.82%
jan 1, 1985
180.0K
-120.0K
-40.0%
jan 1, 1986
80.0K
-100.0K
-55.56%
jan 1, 1987
100.0K
+20.0K
25.0%
jan 1, 1988
560.0K
+460.0K
460.0%
jan 1, 1989
400.0K
-160.0K
-28.57%
jan 1, 1990
820.0K
+420.0K
105.0%
jan 1, 1991
1.1 mln
+280.0K
34.15%
jan 1, 1992
1.41 mln
+310.0K
28.18%
jan 1, 1993
1.79 mln
+380.0K
26.95%
jan 1, 1994
4.24 mln
+2.45 mln
136.87%
jan 1, 1995
2.48 mln
-1.76 mln
-41.51%
jan 1, 1996
2.81 mln
+330.0K
13.31%
jan 1, 1997
2.62 mln
-190.0K
-6.76%
jan 1, 1998
2.22 mln
-400.0K
-15.27%
jan 1, 1999
2.01 mln
-210.0K
-9.46%
jan 1, 2000
2.04 mln
+30.0K
1.49%
jan 1, 2001
1.73 mln
-310.0K
-15.2%
jan 1, 2002
1.91 mln
+180.0K
10.4%
jan 1, 2003
1.82 mln
-90.0K
-4.71%
jan 1, 2004
1.56 mln
-260.0K
-14.29%
jan 1, 2005
1.65 mln
+90.0K
5.77%
jan 1, 2006
1.99 mln
+340.0K
20.61%
jan 1, 2007
2.77 mln
+780.0K
39.2%
jan 1, 2008
2.93 mln
+160.0K
5.78%
jan 1, 2009
3.16 mln
+230.0K
7.85%
jan 1, 2010
2.51 mln
-650.0K
-20.57%
jan 1, 2011
1.96 mln
-550.0K
-21.91%
jan 1, 2012
1.59 mln
-370.0K
-18.88%
jan 1, 2013
1.34 mln
-250.0K
-15.72%
jan 1, 2014
1.4 mln
+60.0K
4.48%
jan 1, 2015
1.58 mln
+180.0K
12.86%
Ranking of countries by current statistics by years


Comments: