30
/
AIzaSyAYiBZKx7MnpbEhh9jyipgxe19OcubqV5w
April 1, 2024
204388
Myanmar
MMR
true
2
1
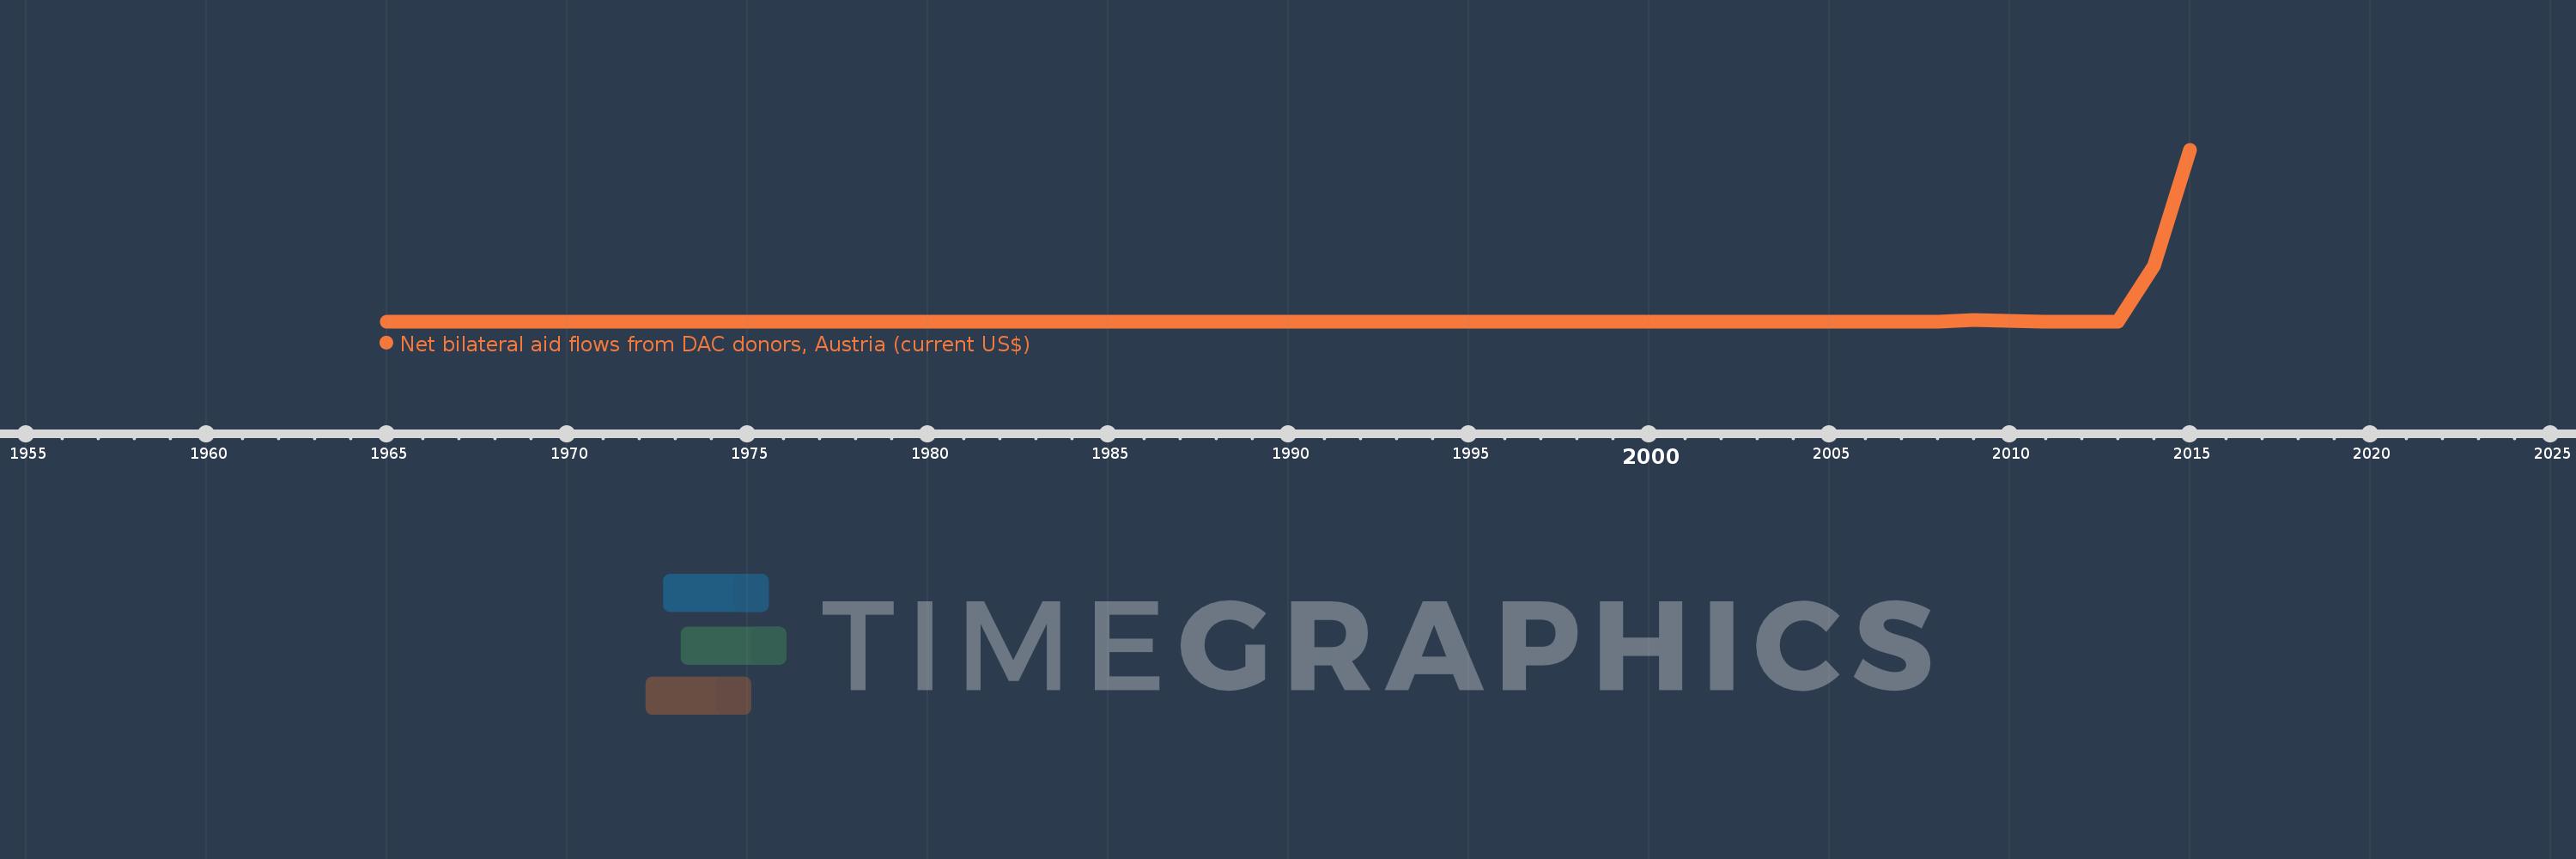
Net bilateral aid flows from DAC donors, Austria (current US$)
2015,2014,2013,2012,2011,2010,2009,2008,2007,2006,2005,2002,2001,2000,1999,1998,1997,1996,1991,1988,1987,1986,1985,1983,1974,1973,1966,1965
