29
/
en
AIzaSyAYiBZKx7MnpbEhh9jyipgxe19OcubqV5w
April 1, 2024
205562
Namibia
NAM
true
2
1
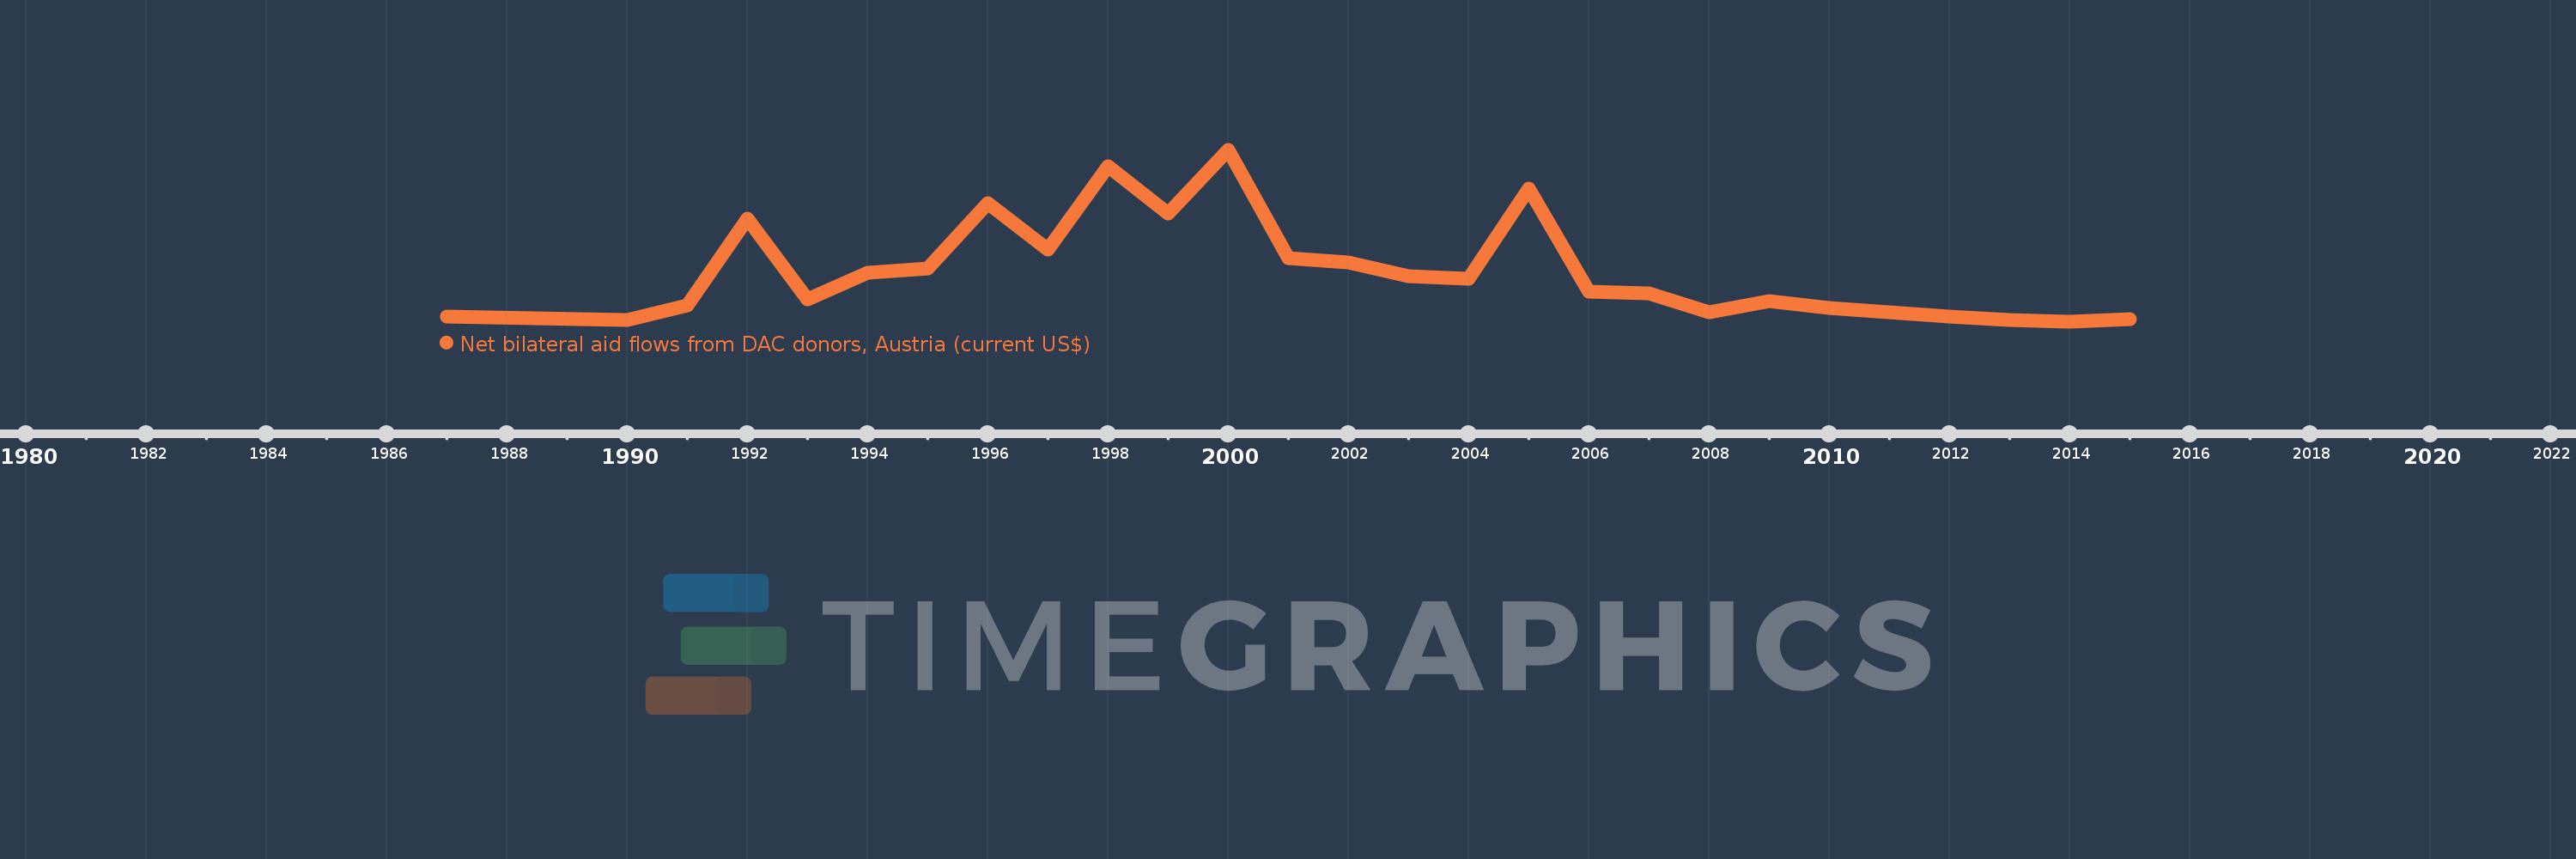
Net bilateral aid flows from DAC donors, Austria (current US$)
2015,2014,2013,2012,2010,2009,2008,2007,2006,2005,2004,2003,2002,2001,2000,1999,1998,1997,1996,1995,1994,1993,1992,1991,1990,1987
This statistics in other country:
AfghanistanAlbaniaAlgeriaAngolaAntigua and BarbudaArab WorldArgentinaArmeniaAzerbaijanBahamas, TheBahrainBangladeshBarbadosBelarusBelizeBeninBhutanBoliviaBosnia and HerzegovinaBotswanaBrazilBulgariaBurkina FasoBurundiCabo VerdeCambodiaCameroonCaribbean small statesCentral African RepublicCentral Europe and the BalticsChadChileChinaColombiaComorosCongo, Dem. Rep.Congo, Rep.Costa RicaCote d'IvoireCroatiaCubaCyprusCzech RepublicDjiboutiDominicaDominican RepublicEast Asia & PacificEast Asia & Pacific (excluding high income)East Asia & Pacific (IDA & IBRD countries)EcuadorEgypt, Arab Rep.El SalvadorEquatorial GuineaEritreaEstoniaEthiopiaEuro areaEurope & Central AsiaEurope & Central Asia (excluding high income)Europe & Central Asia (IDA & IBRD countries)European UnionFijiFragile and conflict affected situationsFrench PolynesiaGabonGambia, TheGeorgiaGhanaGrenadaGuatemalaGuineaGuinea-BissauGuyanaHaitiHeavily indebted poor countries (HIPC)High incomeHondurasHong Kong SAR, ChinaHungaryIBRD onlyIDA & IBRD totalIDA blendIDA onlyIDA totalIndiaIndonesiaIran, Islamic Rep.IraqIsraelJamaicaJordanKazakhstanKenyaKorea, Dem. People’s Rep.Korea, Rep.KosovoKuwaitKyrgyz RepublicLao PDRLatin America & Caribbean Latin America & Caribbean (excluding high income)Latin America & the Caribbean (IDA & IBRD countries)LatviaLeast developed countries: UN classificationLebanonLesothoLiberiaLibyaLithuaniaLow & middle incomeLow incomeLower middle incomeMacedonia, FYRMadagascarMalawiMalaysiaMaldivesMaliMaltaMauritaniaMauritiusMexicoMiddle East & North AfricaMiddle East & North Africa (excluding high income)Middle East & North Africa (IDA & IBRD countries)Middle incomeMoldovaMongoliaMontenegroMoroccoMozambiqueMyanmarNamibiaNepalNicaraguaNigerNigeriaOECD membersOmanOther small statesPacific island small statesPakistanPalauPanamaPapua New GuineaParaguayPeruPhilippinesPolandQatarRomaniaRussian FederationRwandaSamoaSao Tome and PrincipeSaudi ArabiaSenegalSerbiaSeychellesSierra LeoneSingaporeSlovak RepublicSloveniaSmall statesSolomon IslandsSomaliaSouth AfricaSouth AsiaSouth Asia (IDA & IBRD)South SudanSri LankaSt. Kitts and NevisSt. LuciaSt. Vincent and the GrenadinesSub-Saharan Africa Sub-Saharan Africa (excluding high income)Sub-Saharan Africa (IDA & IBRD countries)SudanSurinameSwazilandSyrian Arab RepublicTajikistanTanzaniaThailandTimor-LesteTogoTrinidad and TobagoTunisiaTurkeyTurkmenistanUgandaUkraineUnited Arab EmiratesUpper middle incomeUruguayUzbekistanVanuatuVenezuela, RBVietnamWest Bank and GazaWorldYemen, Rep.ZambiaZimbabwe Timeline:
This timeline shows a graph from 1987 to 2015 of Namibia. No data until 1986. Number of actual observations by date: 26.
Source name:
World Development Indicators
Source organization:
Development Assistance Committee of the Organisation for Economic Co-operation and Development, Geographical Distribution of Financial Flows to Developing Countries, Development Co-operation Report, and International Development Statistics database. Data are available online at: www.oecd.org/dac/stats/idsonline.
Categories, topics:
Aid Effectiveness
Last updated:
apr 23, 2017
Indicators value changes by year
Maximum:
2.11 mln
jan 1, 2000
At the date of observation
Value
Absolute change
Change from previous value
jan 1, 1987
70.0K
+70.0K
0.0%
jan 1, 1990
20.0K
-50.0K
-71.43%
jan 1, 1991
200.0K
+180.0K
900.0%
jan 1, 1992
1.27 mln
+1.07 mln
535.0%
jan 1, 1993
280.0K
-990.0K
-77.95%
jan 1, 1994
600.0K
+320.0K
114.29%
jan 1, 1995
660.0K
+60.0K
10.0%
jan 1, 1996
1.46 mln
+800.0K
121.21%
jan 1, 1997
890.0K
-570.0K
-39.04%
jan 1, 1998
1.91 mln
+1.02 mln
114.61%
jan 1, 1999
1.33 mln
-580.0K
-30.37%
jan 1, 2000
2.11 mln
+780.0K
58.65%
jan 1, 2001
780.0K
-1.33 mln
-63.03%
jan 1, 2002
730.0K
-50.0K
-6.41%
jan 1, 2003
560.0K
-170.0K
-23.29%
jan 1, 2004
530.0K
-30.0K
-5.36%
jan 1, 2005
1.64 mln
+1.11 mln
209.43%
jan 1, 2006
370.0K
-1.27 mln
-77.44%
jan 1, 2007
350.0K
-20.0K
-5.41%
jan 1, 2008
120.0K
-230.0K
-65.71%
jan 1, 2009
260.0K
+140.0K
116.67%
jan 1, 2010
170.0K
-90.0K
-34.62%
jan 1, 2012
70.0K
-100.0K
-58.82%
jan 1, 2013
20.0K
-50.0K
-71.43%
jan 1, 2014
0.0
-20.0K
-100.0%
jan 1, 2015
40.0K
+40.0K
%
Ranking of countries by current statistics by years


Comments: