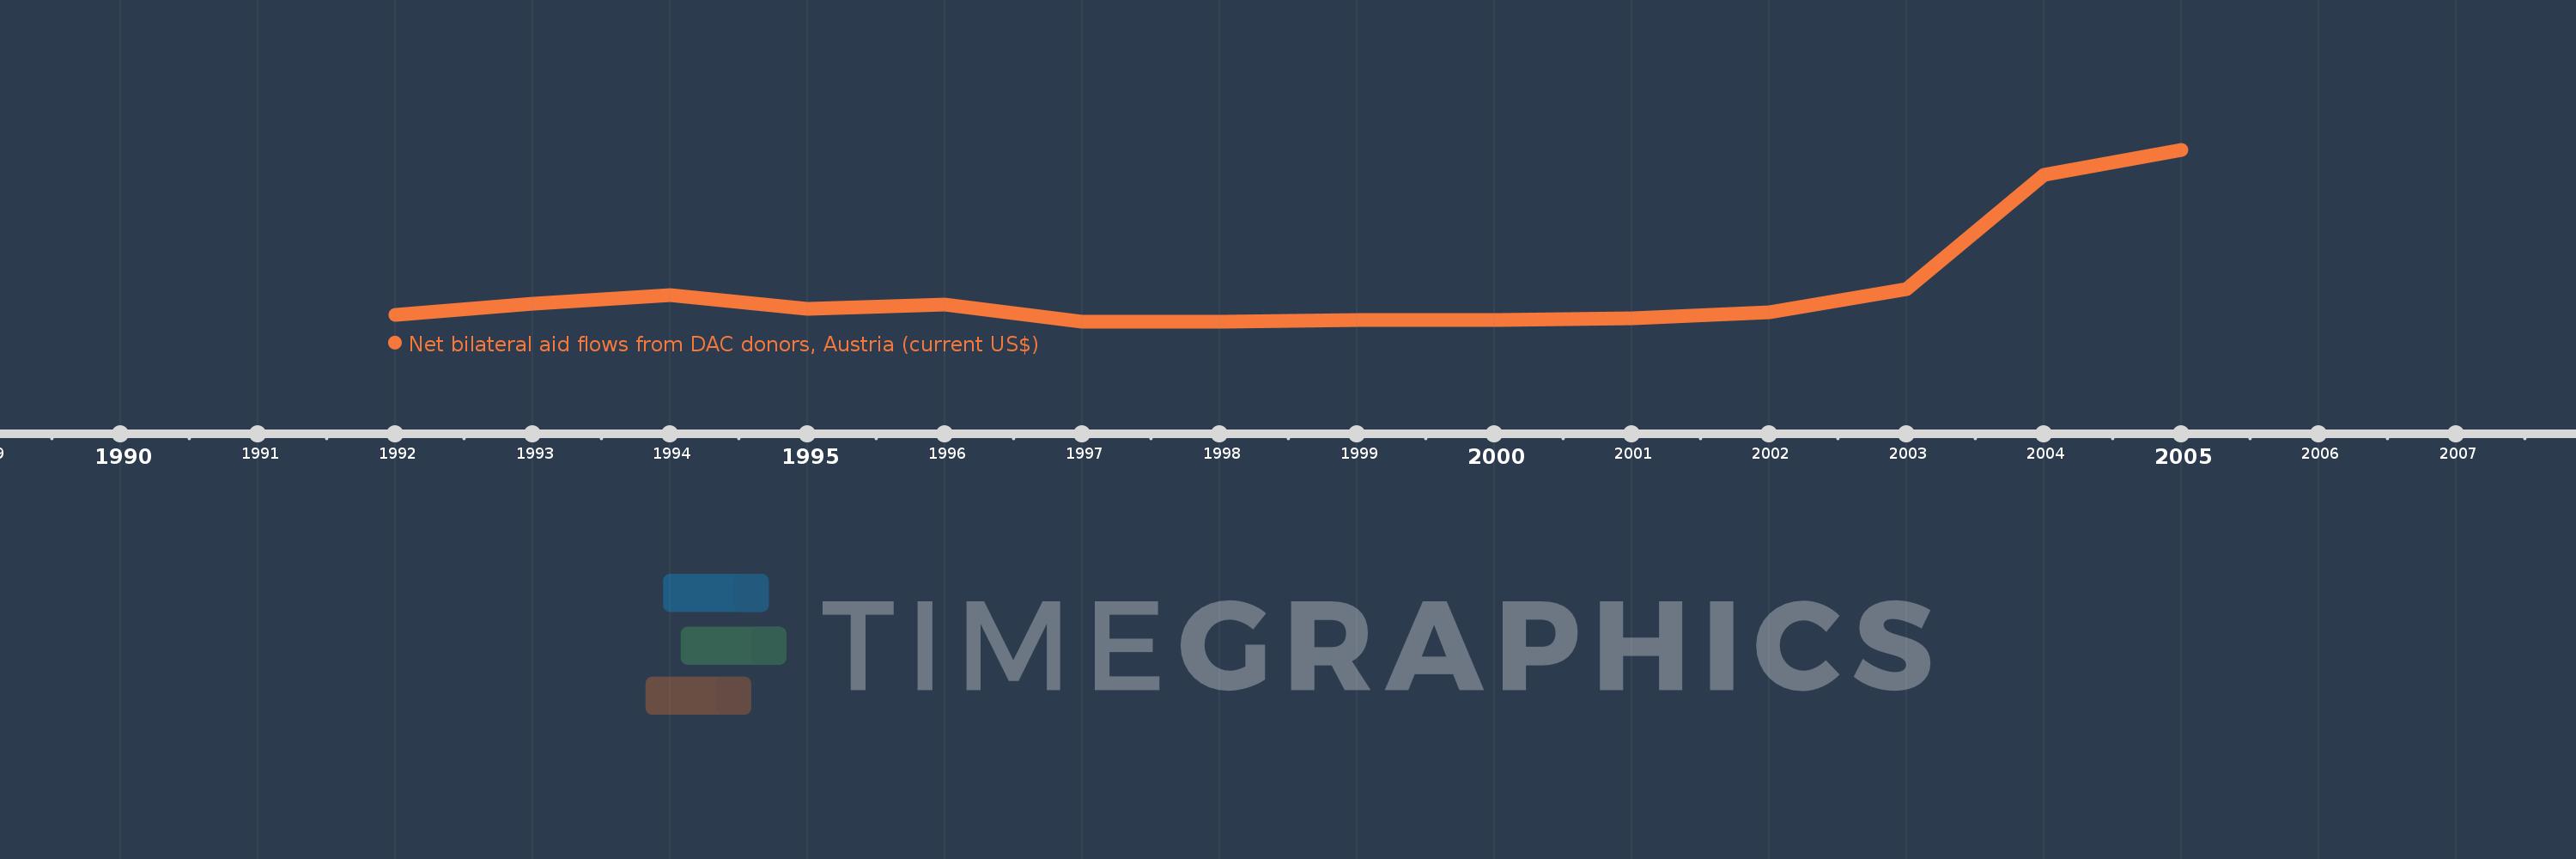
This timeline shows a graph from 1992 to 2005 of Russian Federation. No data until 1991. Number of actual observations by date: 14.
Source name:
World Development Indicators
Source organization:
Development Assistance Committee of the Organisation for Economic Co-operation and Development, Geographical Distribution of Financial Flows to Developing Countries, Development Co-operation Report, and International Development Statistics database. Data are available online at: www.oecd.org/dac/stats/idsonline.
Categories, topics:
Aid Effectiveness
Last updated:
apr 23, 2017
Indicators value changes by year
Meaning:
4.697 mln
Minimum:
470.0K
jan 1, 1997
Maximum:
22.99 mln
jan 1, 2005
At the date of observation
Value
Absolute change
Change from the previous value
jan 1, 1992
1.37 mln
+1.37 mln
0.0%
jan 1, 1993
2.87 mln
+1.5 mln
109.49%
jan 1, 1994
3.96 mln
+1.09 mln
37.98%
jan 1, 1995
2.14 mln
-1.82 mln
-45.96%
jan 1, 1996
2.7 mln
+560.0K
26.17%
jan 1, 1997
470.0K
-2.23 mln
-82.59%
jan 1, 1998
560.0K
+90.0K
19.15%
jan 1, 1999
730.0K
+170.0K
30.36%
jan 1, 2000
680.0K
-50.0K
-6.85%
jan 1, 2001
970.0K
+290.0K
42.65%
jan 1, 2002
1.75 mln
+780.0K
80.41%
jan 1, 2003
4.77 mln
+3.02 mln
172.57%
jan 1, 2004
19.8 mln
+15.03 mln
315.09%
jan 1, 2005
22.99 mln
+3.19 mln
16.11%
Ranking of countries by current statistics by years
