29
/
en
AIzaSyAYiBZKx7MnpbEhh9jyipgxe19OcubqV5w
April 1, 2024
91341
Brazil
BRA
true
2
1
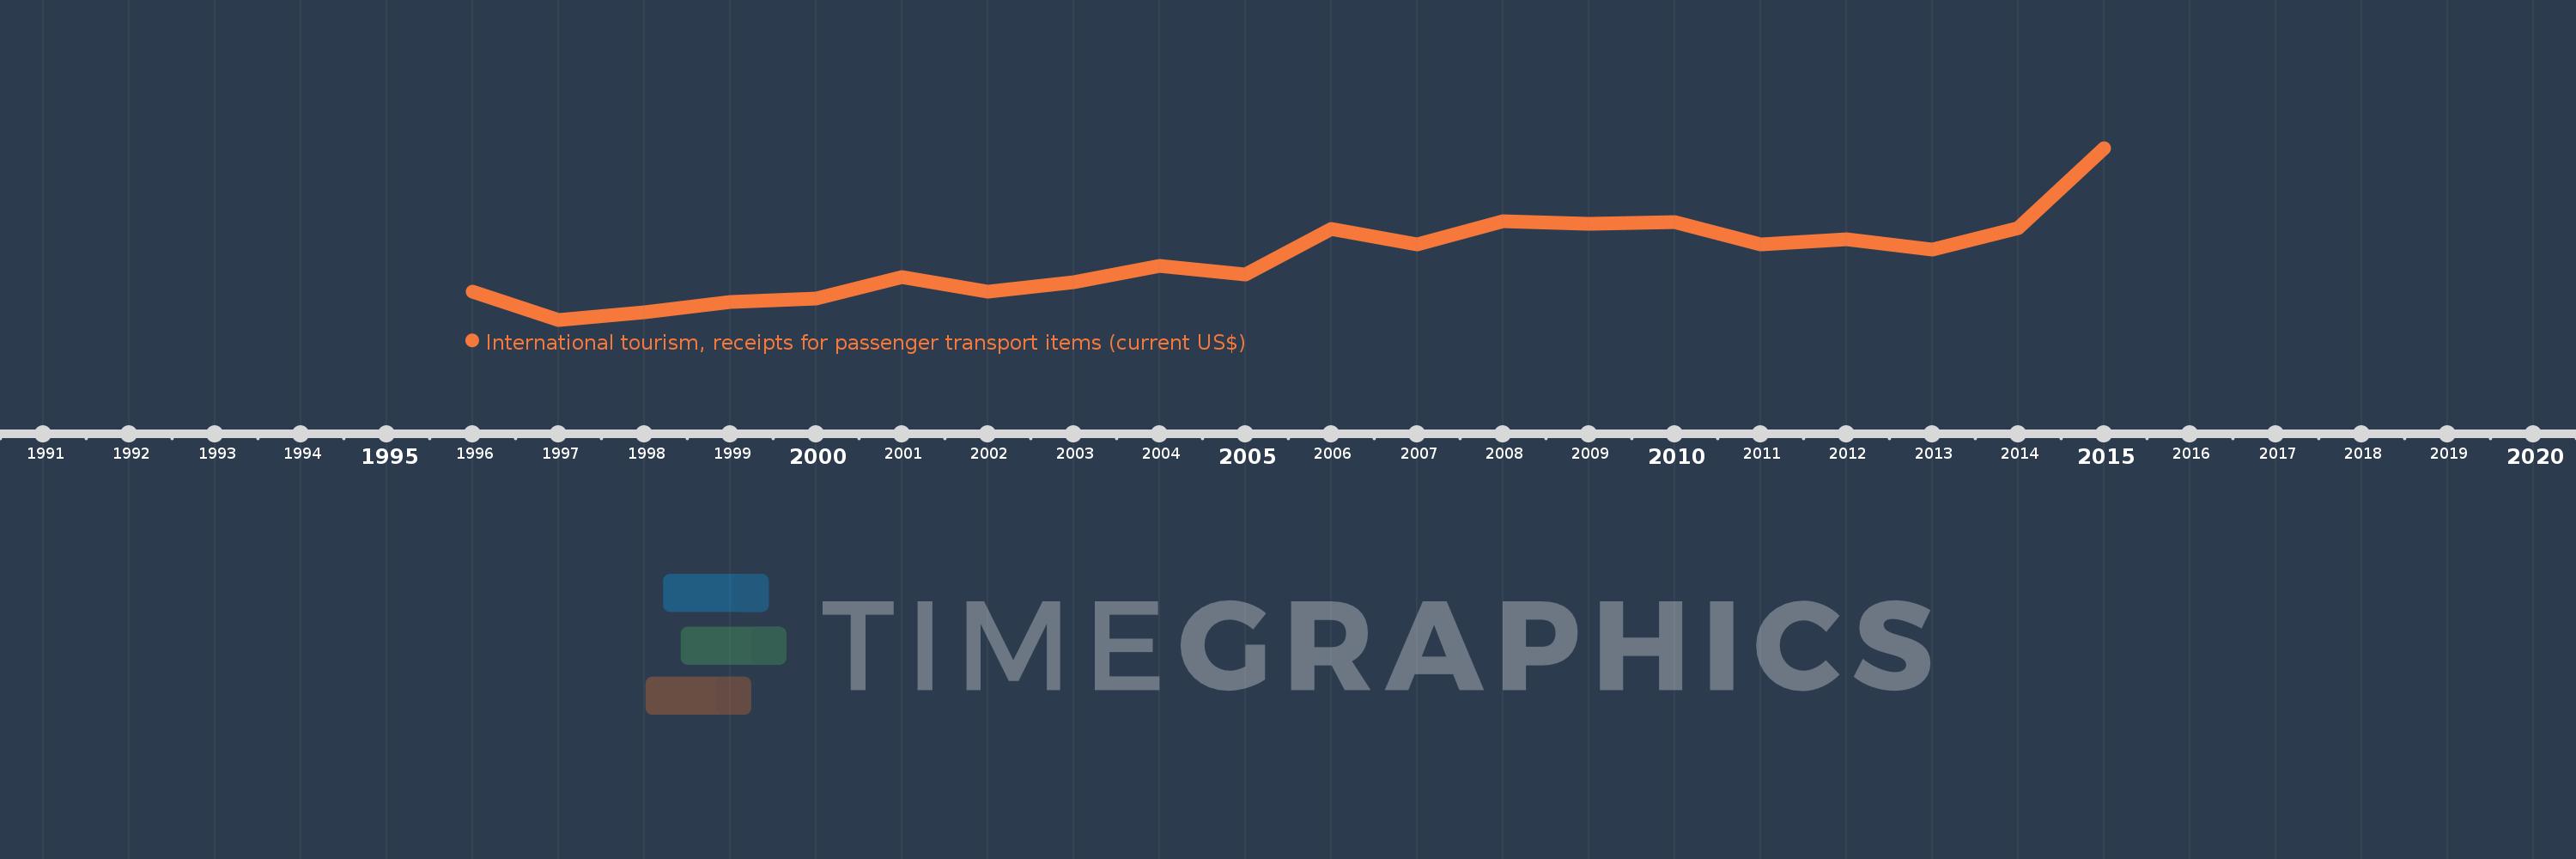
International tourism, receipts for passenger transport items (current US$)
2015,2014,2013,2012,2011,2010,2009,2008,2007,2006,2005,2004,2003,2002,2001,2000,1999,1998,1997,1996
This statistics in other country:
AfghanistanAlbaniaAlgeriaAngolaArgentinaArmeniaArubaAustraliaAustriaAzerbaijanBahamas, TheBahrainBangladeshBarbadosBelarusBelgiumBelizeBeninBermudaBhutanBoliviaBosnia and HerzegovinaBotswanaBrazilBulgariaBurkina FasoBurundiCabo VerdeCambodiaCameroonCanadaCaribbean small statesCentral African RepublicCentral Europe and the BalticsChileChinaColombiaComorosCongo, Rep.Costa RicaCote d'IvoireCroatiaCubaCuracaoCyprusCzech RepublicEarly-demographic dividendEast Asia & PacificEast Asia & Pacific (excluding high income)East Asia & Pacific (IDA & IBRD countries)EcuadorEgypt, Arab Rep.El SalvadorEstoniaEthiopiaEuro areaEurope & Central AsiaEurope & Central Asia (excluding high income)Europe & Central Asia (IDA & IBRD countries)European UnionFijiFinlandFragile and conflict affected situationsFranceFrench PolynesiaGabonGambia, TheGeorgiaGermanyGhanaGreeceGuatemalaGuineaGuinea-BissauGuyanaHigh incomeHondurasHong Kong SAR, ChinaHungaryIBRD onlyIcelandIDA & IBRD totalIndiaIndonesiaIran, Islamic Rep.IraqIrelandIsraelItalyJamaicaJapanJordanKazakhstanKenyaKiribatiKorea, Rep.KuwaitKyrgyz RepublicLao PDRLate-demographic dividendLatin America & Caribbean Latin America & Caribbean (excluding high income)Latin America & the Caribbean (IDA & IBRD countries)LatviaLebanonLesothoLibyaLithuaniaLow & middle incomeLuxembourgMacao SAR, ChinaMacedonia, FYRMadagascarMalawiMalaysiaMaliMaltaMarshall IslandsMauritaniaMauritiusMexicoMiddle East & North AfricaMiddle East & North Africa (excluding high income)Middle East & North Africa (IDA & IBRD countries)Middle incomeMoldovaMongoliaMontenegroMoroccoMozambiqueMyanmarNamibiaNepalNetherlandsNicaraguaNigerNigeriaNorth AmericaNorwayOECD membersOmanPacific island small statesPakistanPalauPanamaPapua New GuineaParaguayPeruPhilippinesPolandPortugalPost-demographic dividendPre-demographic dividendQatarRomaniaRussian FederationRwandaSamoaSao Tome and PrincipeSaudi ArabiaSenegalSerbiaSeychellesSint Maarten (Dutch part)Slovak RepublicSloveniaSolomon IslandsSouth AfricaSpainSri LankaSub-Saharan Africa Sub-Saharan Africa (excluding high income)Sub-Saharan Africa (IDA & IBRD countries)SurinameSwazilandSwedenSwitzerlandSyrian Arab RepublicTajikistanTanzaniaThailandTogoTongaTrinidad and TobagoTunisiaTurkeyTurkmenistanUgandaUkraineUnited KingdomUnited StatesUpper middle incomeUruguayUzbekistanVanuatuVenezuela, RBWorld Timeline:
This timeline shows a graph from 1996 to 2015 of Brazil. No data until 1995. Number of actual observations by date: 20.
Source name:
World Development Indicators
Source organization:
World Tourism Organization, Yearbook of Tourism Statistics, Compendium of Tourism Statistics and data files.
Categories, topics:
Private Sector, Trade
Last updated:
apr 23, 2017
Indicators value changes by year
Minimum:
26.0 mln
jan 1, 1997
Maximum:
560.0 mln
jan 1, 2015
At the date of observation
Value
Absolute change
Change from previous value
jan 1, 1996
113.0 mln
+113.0 mln
0.0%
jan 1, 1997
26.0 mln
-87.0 mln
-76.99%
jan 1, 1998
48.0 mln
+22.0 mln
84.62%
jan 1, 1999
81.0 mln
+33.0 mln
68.75%
jan 1, 2000
92.0 mln
+11.0 mln
13.58%
jan 1, 2001
159.0 mln
+67.0 mln
72.83%
jan 1, 2002
113.0 mln
-46.0 mln
-28.93%
jan 1, 2003
144.0 mln
+31.0 mln
27.43%
jan 1, 2004
194.0 mln
+50.0 mln
34.72%
jan 1, 2005
167.0 mln
-27.0 mln
-13.92%
jan 1, 2006
307.0 mln
+140.0 mln
83.83%
jan 1, 2007
261.0 mln
-46.0 mln
-14.98%
jan 1, 2008
331.0 mln
+70.0 mln
26.82%
jan 1, 2009
324.0 mln
-7.0 mln
-2.11%
jan 1, 2010
330.0 mln
+6.0 mln
1.85%
jan 1, 2011
261.0 mln
-69.0 mln
-20.91%
jan 1, 2012
275.0 mln
+14.0 mln
5.36%
jan 1, 2013
245.0 mln
-30.0 mln
-10.91%
jan 1, 2014
310.0 mln
+65.0 mln
26.53%
jan 1, 2015
560.0 mln
+250.0 mln
80.65%
Ranking of countries by current statistics by years


Comments: