29
/
en
AIzaSyAYiBZKx7MnpbEhh9jyipgxe19OcubqV5w
April 1, 2024
170110
Korea, Rep.
KOR
true
2
1
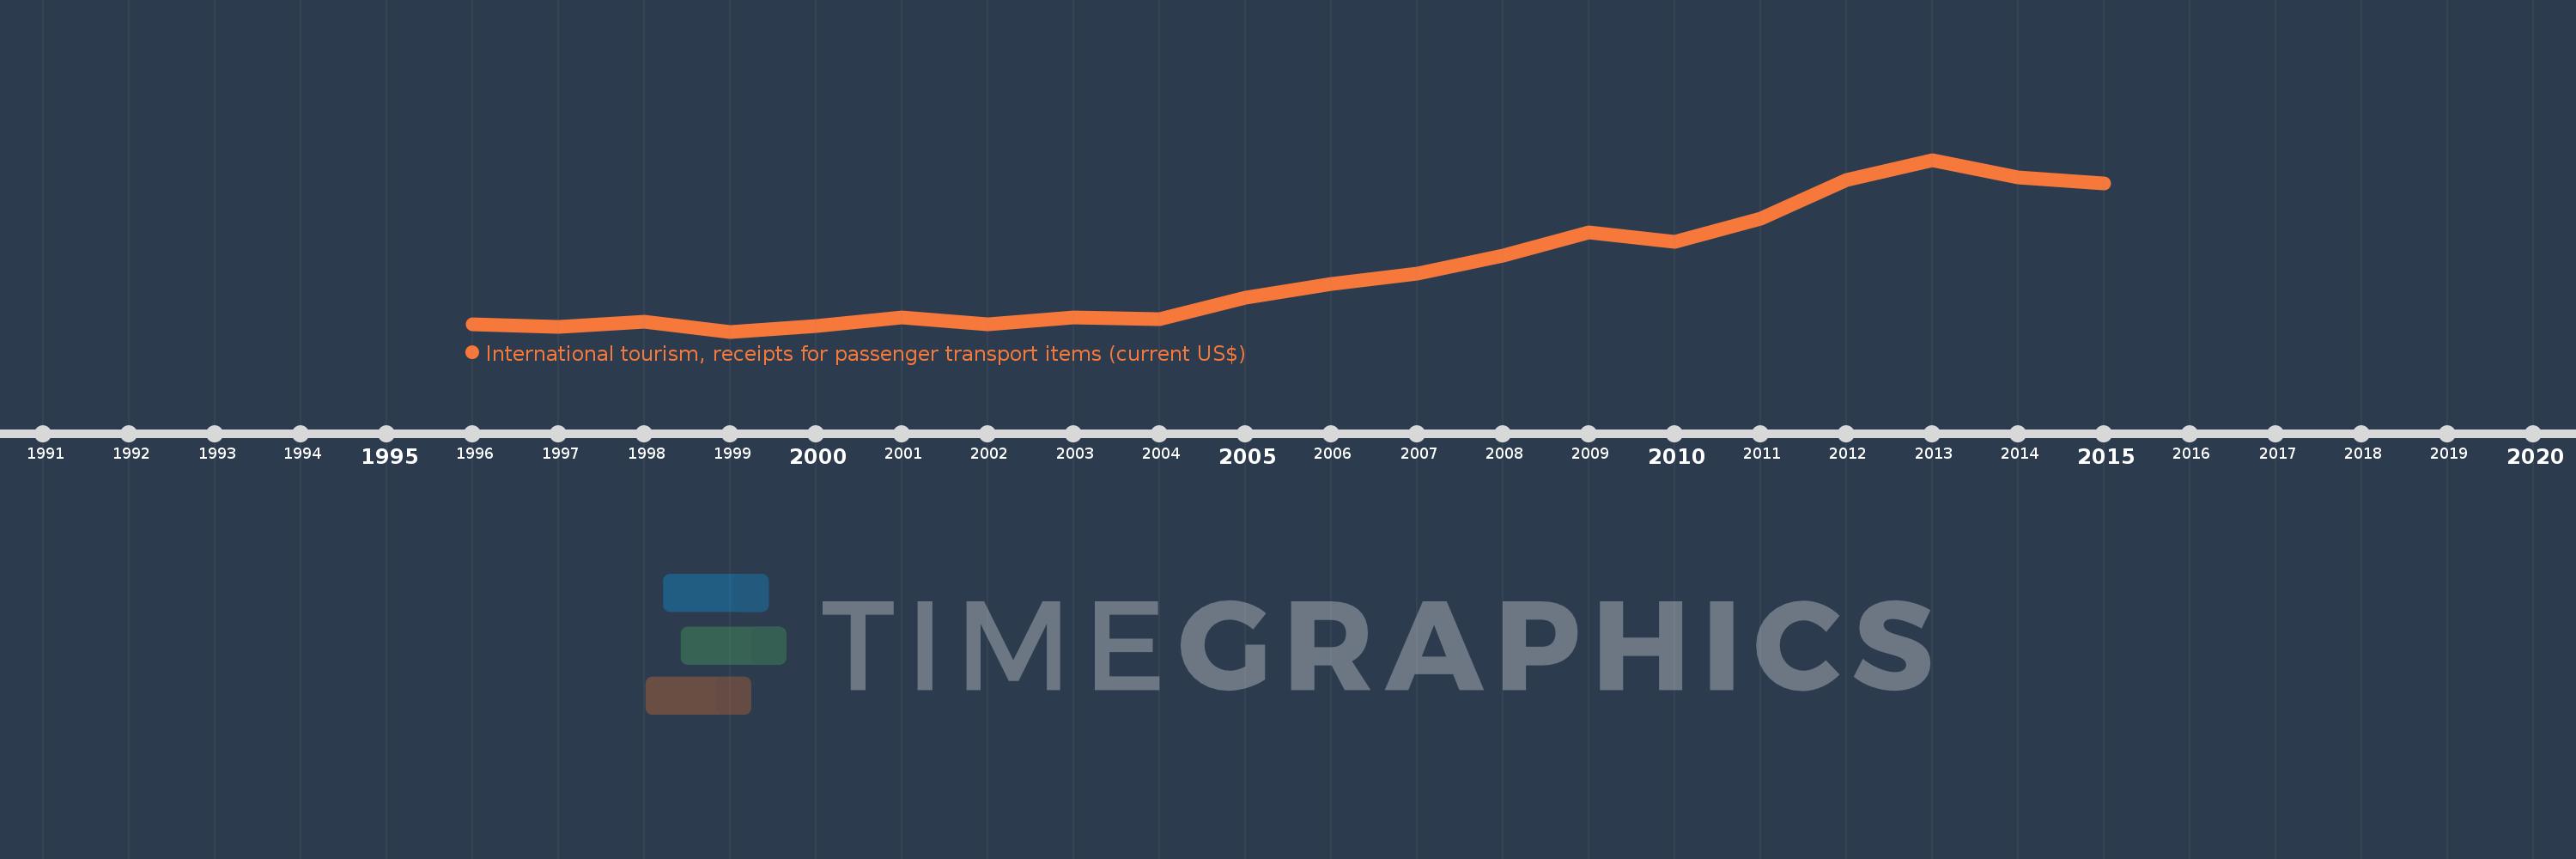
International tourism, receipts for passenger transport items (current US$)
2015,2014,2013,2012,2011,2010,2009,2008,2007,2006,2005,2004,2003,2002,2001,2000,1999,1998,1997,1996
This statistics in other country:
AfghanistanAlbaniaAlgeriaAngolaArgentinaArmeniaArubaAustraliaAustriaAzerbaijanBahamas, TheBahrainBangladeshBarbadosBelarusBelgiumBelizeBeninBermudaBhutanBoliviaBosnia and HerzegovinaBotswanaBrazilBulgariaBurkina FasoBurundiCabo VerdeCambodiaCameroonCanadaCaribbean small statesCentral African RepublicCentral Europe and the BalticsChileChinaColombiaComorosCongo, Rep.Costa RicaCote d'IvoireCroatiaCubaCuracaoCyprusCzech RepublicEarly-demographic dividendEast Asia & PacificEast Asia & Pacific (excluding high income)East Asia & Pacific (IDA & IBRD countries)EcuadorEgypt, Arab Rep.El SalvadorEstoniaEthiopiaEuro areaEurope & Central AsiaEurope & Central Asia (excluding high income)Europe & Central Asia (IDA & IBRD countries)European UnionFijiFinlandFragile and conflict affected situationsFranceFrench PolynesiaGabonGambia, TheGeorgiaGermanyGhanaGreeceGuatemalaGuineaGuinea-BissauGuyanaHigh incomeHondurasHong Kong SAR, ChinaHungaryIBRD onlyIcelandIDA & IBRD totalIndiaIndonesiaIran, Islamic Rep.IraqIrelandIsraelItalyJamaicaJapanJordanKazakhstanKenyaKiribatiKorea, Rep.KuwaitKyrgyz RepublicLao PDRLate-demographic dividendLatin America & Caribbean Latin America & Caribbean (excluding high income)Latin America & the Caribbean (IDA & IBRD countries)LatviaLebanonLesothoLibyaLithuaniaLow & middle incomeLuxembourgMacao SAR, ChinaMacedonia, FYRMadagascarMalawiMalaysiaMaliMaltaMarshall IslandsMauritaniaMauritiusMexicoMiddle East & North AfricaMiddle East & North Africa (excluding high income)Middle East & North Africa (IDA & IBRD countries)Middle incomeMoldovaMongoliaMontenegroMoroccoMozambiqueMyanmarNamibiaNepalNetherlandsNicaraguaNigerNigeriaNorth AmericaNorwayOECD membersOmanPacific island small statesPakistanPalauPanamaPapua New GuineaParaguayPeruPhilippinesPolandPortugalPost-demographic dividendPre-demographic dividendQatarRomaniaRussian FederationRwandaSamoaSao Tome and PrincipeSaudi ArabiaSenegalSerbiaSeychellesSint Maarten (Dutch part)Slovak RepublicSloveniaSolomon IslandsSouth AfricaSpainSri LankaSub-Saharan Africa Sub-Saharan Africa (excluding high income)Sub-Saharan Africa (IDA & IBRD countries)SurinameSwazilandSwedenSwitzerlandSyrian Arab RepublicTajikistanTanzaniaThailandTogoTongaTrinidad and TobagoTunisiaTurkeyTurkmenistanUgandaUkraineUnited KingdomUnited StatesUpper middle incomeUruguayUzbekistanVanuatuVenezuela, RBWorld Timeline:
This timeline shows a graph from 1996 to 2015 of Korea, Rep.. No data until 1995. Number of actual observations by date: 20.
Source name:
World Development Indicators
Source organization:
World Tourism Organization, Yearbook of Tourism Statistics, Compendium of Tourism Statistics and data files.
Categories, topics:
Private Sector, Trade
Last updated:
apr 23, 2017
Indicators value changes by year
Minimum:
1.355 bln
jan 1, 1999
Maximum:
5.422 bln
jan 1, 2013
At the date of observation
Value
Absolute change
Change from previous value
jan 1, 1996
1.52 bln
+1.52 bln
0.0%
jan 1, 1997
1.47 bln
-50.0 mln
-3.29%
jan 1, 1998
1.586 bln
+116.0 mln
7.89%
jan 1, 1999
1.355 bln
-231.0 mln
-14.56%
jan 1, 2000
1.496 bln
+141.0 mln
10.41%
jan 1, 2001
1.693 bln
+197.0 mln
13.17%
jan 1, 2002
1.535 bln
-158.0 mln
-9.33%
jan 1, 2003
1.685 bln
+150.0 mln
9.77%
jan 1, 2004
1.647 bln
-38.0 mln
-2.26%
jan 1, 2005
2.157 bln
+510.0 mln
30.97%
jan 1, 2006
2.484 bln
+327.0 mln
15.16%
jan 1, 2007
2.72 bln
+236.0 mln
9.5%
jan 1, 2008
3.15 bln
+430.0 mln
15.81%
jan 1, 2009
3.705 bln
+555.0 mln
17.62%
jan 1, 2010
3.485 bln
-220.0 mln
-5.94%
jan 1, 2011
4.039 bln
+554.0 mln
15.9%
jan 1, 2012
4.942 bln
+903.0 mln
22.36%
jan 1, 2013
5.422 bln
+480.0 mln
9.71%
jan 1, 2014
5.015 bln
-407.0 mln
-7.51%
jan 1, 2015
4.861 bln
-154.0 mln
-3.07%
Ranking of countries by current statistics by years


Comments: