29
/
en
AIzaSyAYiBZKx7MnpbEhh9jyipgxe19OcubqV5w
April 1, 2024
276811
United States
USA
true
2
1
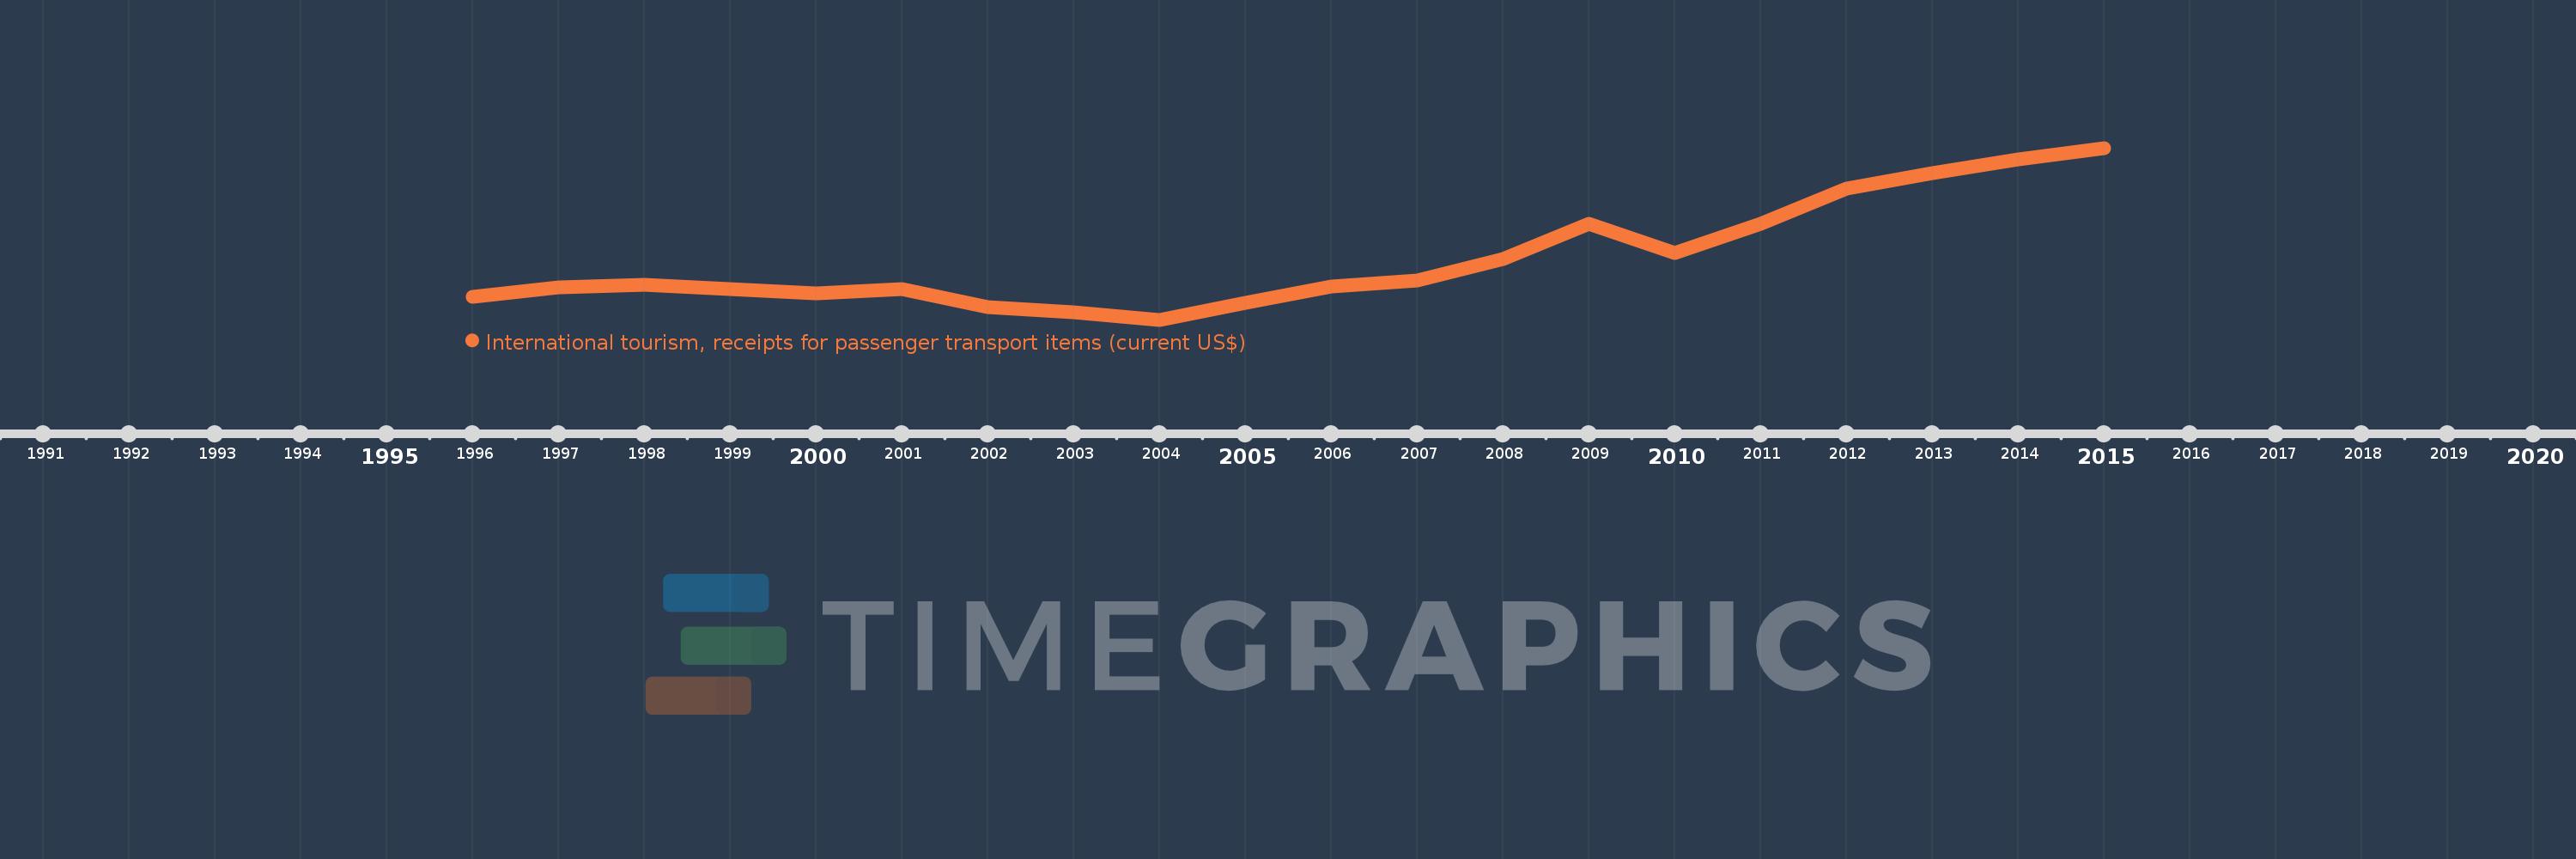
International tourism, receipts for passenger transport items (current US$)
2015,2014,2013,2012,2011,2010,2009,2008,2007,2006,2005,2004,2003,2002,2001,2000,1999,1998,1997,1996
This statistics in other country:
AfghanistanAlbaniaAlgeriaAngolaArgentinaArmeniaArubaAustraliaAustriaAzerbaijanBahamas, TheBahrainBangladeshBarbadosBelarusBelgiumBelizeBeninBermudaBhutanBoliviaBosnia and HerzegovinaBotswanaBrazilBulgariaBurkina FasoBurundiCabo VerdeCambodiaCameroonCanadaCaribbean small statesCentral African RepublicCentral Europe and the BalticsChileChinaColombiaComorosCongo, Rep.Costa RicaCote d'IvoireCroatiaCubaCuracaoCyprusCzech RepublicEarly-demographic dividendEast Asia & PacificEast Asia & Pacific (excluding high income)East Asia & Pacific (IDA & IBRD countries)EcuadorEgypt, Arab Rep.El SalvadorEstoniaEthiopiaEuro areaEurope & Central AsiaEurope & Central Asia (excluding high income)Europe & Central Asia (IDA & IBRD countries)European UnionFijiFinlandFragile and conflict affected situationsFranceFrench PolynesiaGabonGambia, TheGeorgiaGermanyGhanaGreeceGuatemalaGuineaGuinea-BissauGuyanaHigh incomeHondurasHong Kong SAR, ChinaHungaryIBRD onlyIcelandIDA & IBRD totalIndiaIndonesiaIran, Islamic Rep.IraqIrelandIsraelItalyJamaicaJapanJordanKazakhstanKenyaKiribatiKorea, Rep.KuwaitKyrgyz RepublicLao PDRLate-demographic dividendLatin America & Caribbean Latin America & Caribbean (excluding high income)Latin America & the Caribbean (IDA & IBRD countries)LatviaLebanonLesothoLibyaLithuaniaLow & middle incomeLuxembourgMacao SAR, ChinaMacedonia, FYRMadagascarMalawiMalaysiaMaliMaltaMarshall IslandsMauritaniaMauritiusMexicoMiddle East & North AfricaMiddle East & North Africa (excluding high income)Middle East & North Africa (IDA & IBRD countries)Middle incomeMoldovaMongoliaMontenegroMoroccoMozambiqueMyanmarNamibiaNepalNetherlandsNicaraguaNigerNigeriaNorth AmericaNorwayOECD membersOmanPacific island small statesPakistanPalauPanamaPapua New GuineaParaguayPeruPhilippinesPolandPortugalPost-demographic dividendPre-demographic dividendQatarRomaniaRussian FederationRwandaSamoaSao Tome and PrincipeSaudi ArabiaSenegalSerbiaSeychellesSint Maarten (Dutch part)Slovak RepublicSloveniaSolomon IslandsSouth AfricaSpainSri LankaSub-Saharan Africa Sub-Saharan Africa (excluding high income)Sub-Saharan Africa (IDA & IBRD countries)SurinameSwazilandSwedenSwitzerlandSyrian Arab RepublicTajikistanTanzaniaThailandTogoTongaTrinidad and TobagoTunisiaTurkeyTurkmenistanUgandaUkraineUnited KingdomUnited StatesUpper middle incomeUruguayUzbekistanVanuatuVenezuela, RBWorld Timeline:
This timeline shows a graph from 1996 to 2015 of United States. No data until 1995. Number of actual observations by date: 20.
Source name:
World Development Indicators
Source organization:
World Tourism Organization, Yearbook of Tourism Statistics, Compendium of Tourism Statistics and data files.
Categories, topics:
Private Sector, Trade
Last updated:
apr 23, 2017
Indicators value changes by year
Minimum:
15.091 bln
jan 1, 2004
Maximum:
43.516 bln
jan 1, 2015
At the date of observation
Value
Absolute change
Change from previous value
jan 1, 1996
18.909 bln
+18.909 bln
0.0%
jan 1, 1997
20.424 bln
+1.515 bln
8.01%
jan 1, 1998
20.872 bln
+448.0 mln
2.19%
jan 1, 1999
20.094 bln
-778.0 mln
-3.73%
jan 1, 2000
19.425 bln
-669.0 mln
-3.33%
jan 1, 2001
20.196 bln
+771.0 mln
3.97%
jan 1, 2002
17.181 bln
-3.015 bln
-14.93%
jan 1, 2003
16.291 bln
-890.0 mln
-5.18%
jan 1, 2004
15.091 bln
-1.2 bln
-7.37%
jan 1, 2005
17.931 bln
+2.84 bln
18.82%
jan 1, 2006
20.608 bln
+2.677 bln
14.93%
jan 1, 2007
21.637 bln
+1.029 bln
4.99%
jan 1, 2008
25.186 bln
+3.549 bln
16.4%
jan 1, 2009
30.956 bln
+5.77 bln
22.91%
jan 1, 2010
26.102 bln
-4.854 bln
-15.68%
jan 1, 2011
30.986 bln
+4.884 bln
18.71%
jan 1, 2012
36.763 bln
+5.777 bln
18.64%
jan 1, 2013
39.364 bln
+2.601 bln
7.08%
jan 1, 2014
41.642 bln
+2.278 bln
5.79%
jan 1, 2015
43.516 bln
+1.874 bln
4.5%
Ranking of countries by current statistics by years


Comments: