29
/
en
AIzaSyAYiBZKx7MnpbEhh9jyipgxe19OcubqV5w
April 1, 2024
107443
Colombia
COL
true
2
1
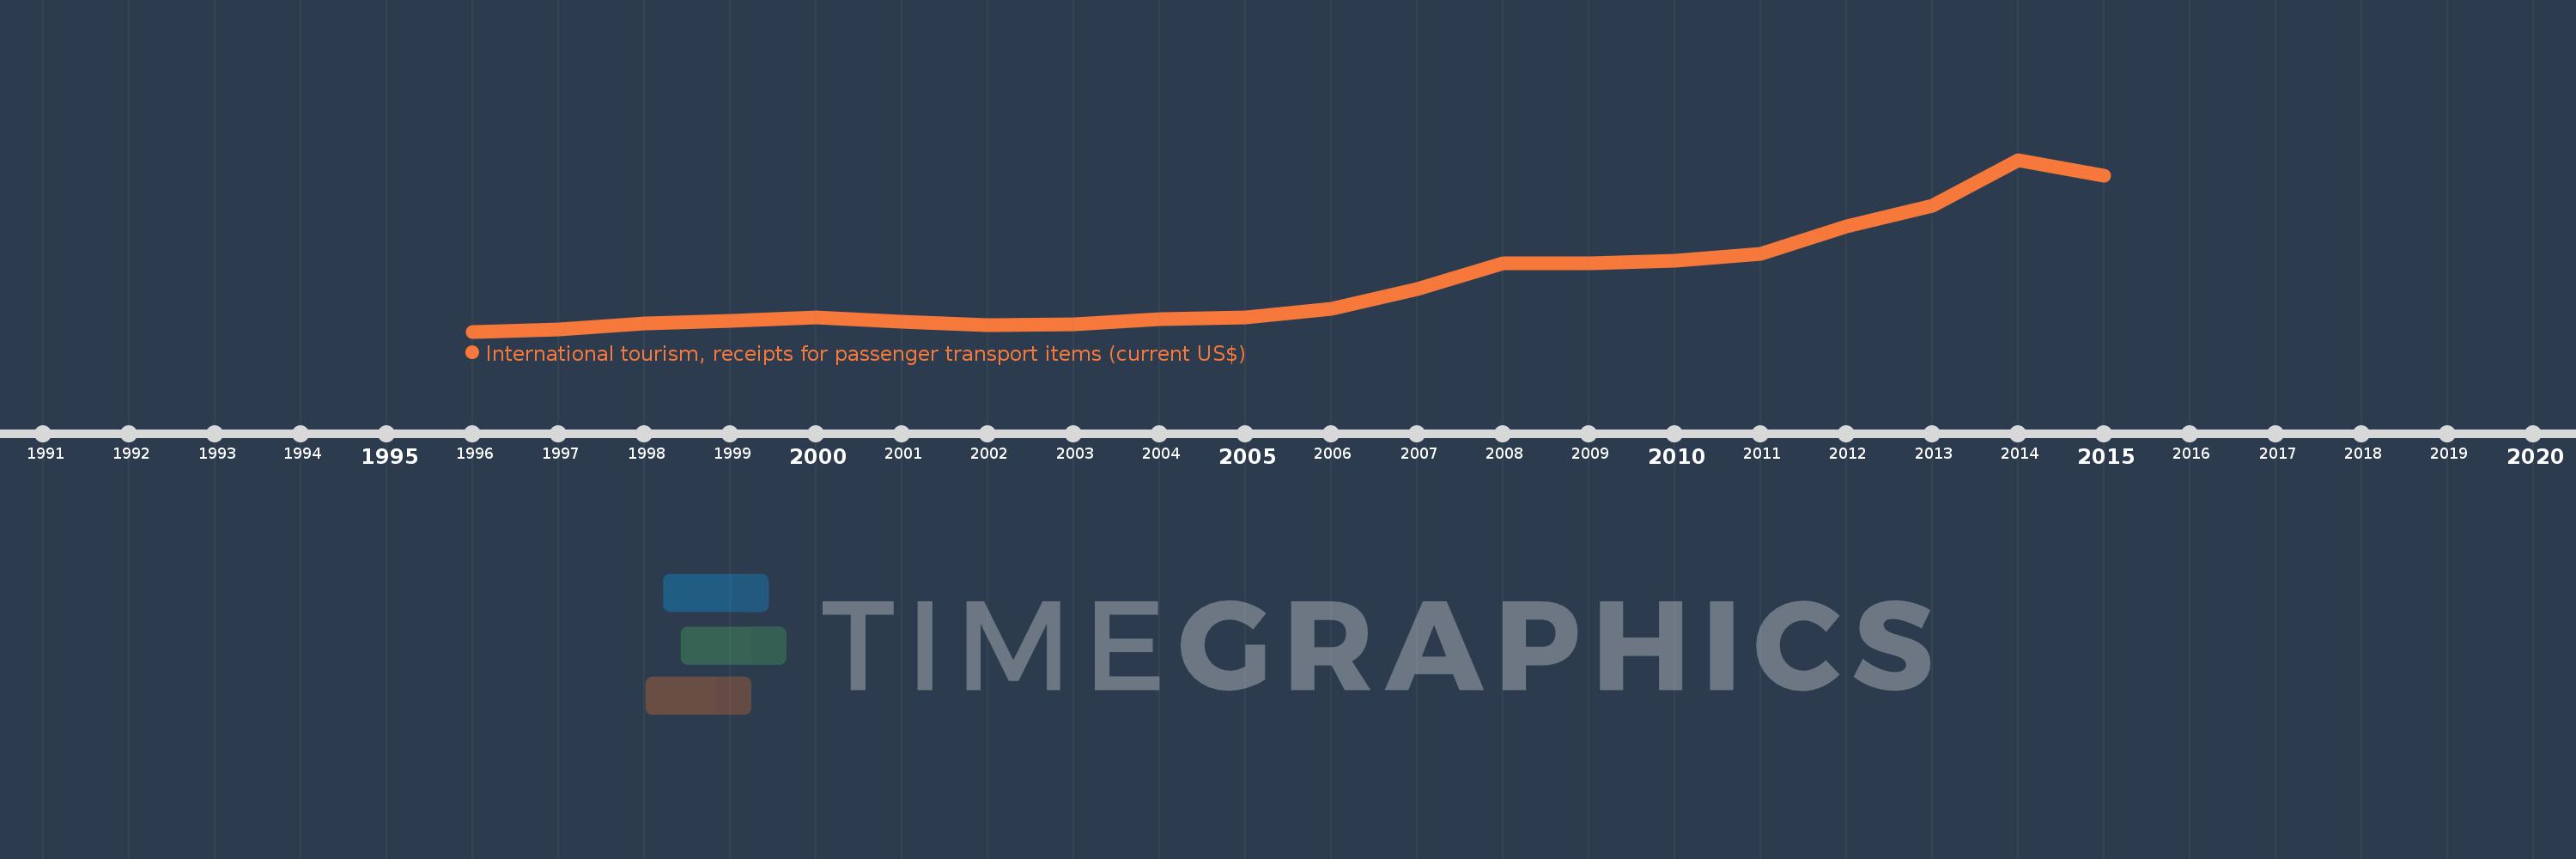
International tourism, receipts for passenger transport items (current US$)
2015,2014,2013,2012,2011,2010,2009,2008,2007,2006,2005,2004,2003,2002,2001,2000,1999,1998,1997,1996
This statistics in other country:
AfghanistanAlbaniaAlgeriaAngolaArgentinaArmeniaArubaAustraliaAustriaAzerbaijanBahamas, TheBahrainBangladeshBarbadosBelarusBelgiumBelizeBeninBermudaBhutanBoliviaBosnia and HerzegovinaBotswanaBrazilBulgariaBurkina FasoBurundiCabo VerdeCambodiaCameroonCanadaCaribbean small statesCentral African RepublicCentral Europe and the BalticsChileChinaColombiaComorosCongo, Rep.Costa RicaCote d'IvoireCroatiaCubaCuracaoCyprusCzech RepublicEarly-demographic dividendEast Asia & PacificEast Asia & Pacific (excluding high income)East Asia & Pacific (IDA & IBRD countries)EcuadorEgypt, Arab Rep.El SalvadorEstoniaEthiopiaEuro areaEurope & Central AsiaEurope & Central Asia (excluding high income)Europe & Central Asia (IDA & IBRD countries)European UnionFijiFinlandFragile and conflict affected situationsFranceFrench PolynesiaGabonGambia, TheGeorgiaGermanyGhanaGreeceGuatemalaGuineaGuinea-BissauGuyanaHigh incomeHondurasHong Kong SAR, ChinaHungaryIBRD onlyIcelandIDA & IBRD totalIndiaIndonesiaIran, Islamic Rep.IraqIrelandIsraelItalyJamaicaJapanJordanKazakhstanKenyaKiribatiKorea, Rep.KuwaitKyrgyz RepublicLao PDRLate-demographic dividendLatin America & Caribbean Latin America & Caribbean (excluding high income)Latin America & the Caribbean (IDA & IBRD countries)LatviaLebanonLesothoLibyaLithuaniaLow & middle incomeLuxembourgMacao SAR, ChinaMacedonia, FYRMadagascarMalawiMalaysiaMaliMaltaMarshall IslandsMauritaniaMauritiusMexicoMiddle East & North AfricaMiddle East & North Africa (excluding high income)Middle East & North Africa (IDA & IBRD countries)Middle incomeMoldovaMongoliaMontenegroMoroccoMozambiqueMyanmarNamibiaNepalNetherlandsNicaraguaNigerNigeriaNorth AmericaNorwayOECD membersOmanPacific island small statesPakistanPalauPanamaPapua New GuineaParaguayPeruPhilippinesPolandPortugalPost-demographic dividendPre-demographic dividendQatarRomaniaRussian FederationRwandaSamoaSao Tome and PrincipeSaudi ArabiaSenegalSerbiaSeychellesSint Maarten (Dutch part)Slovak RepublicSloveniaSolomon IslandsSouth AfricaSpainSri LankaSub-Saharan Africa Sub-Saharan Africa (excluding high income)Sub-Saharan Africa (IDA & IBRD countries)SurinameSwazilandSwedenSwitzerlandSyrian Arab RepublicTajikistanTanzaniaThailandTogoTongaTrinidad and TobagoTunisiaTurkeyTurkmenistanUgandaUkraineUnited KingdomUnited StatesUpper middle incomeUruguayUzbekistanVanuatuVenezuela, RBWorld Timeline:
This timeline shows a graph from 1996 to 2015 of Colombia. No data until 1995. Number of actual observations by date: 20.
Source name:
World Development Indicators
Source organization:
World Tourism Organization, Yearbook of Tourism Statistics, Compendium of Tourism Statistics and data files.
Categories, topics:
Private Sector, Trade
Last updated:
apr 23, 2017
Indicators value changes by year
Minimum:
230.0 mln
jan 1, 1996
Maximum:
1.148 bln
jan 1, 2014
At the date of observation
Value
Absolute change
Change from previous value
jan 1, 1996
230.0 mln
+230.0 mln
0.0%
jan 1, 1997
242.0 mln
+12.0 mln
5.22%
jan 1, 1998
272.0 mln
+30.0 mln
12.4%
jan 1, 1999
288.0 mln
+16.0 mln
5.88%
jan 1, 2000
304.0 mln
+16.0 mln
5.56%
jan 1, 2001
283.0 mln
-21.0 mln
-6.91%
jan 1, 2002
266.0 mln
-17.0 mln
-6.01%
jan 1, 2003
270.0 mln
+4.0 mln
1.5%
jan 1, 2004
298.0 mln
+28.0 mln
10.37%
jan 1, 2005
308.0 mln
+10.0 mln
3.36%
jan 1, 2006
352.0 mln
+44.0 mln
14.29%
jan 1, 2007
455.0 mln
+103.0 mln
29.26%
jan 1, 2008
593.0 mln
+138.0 mln
30.33%
jan 1, 2009
594.0 mln
+1000.0K
0.17%
jan 1, 2010
610.0 mln
+16.0 mln
2.69%
jan 1, 2011
644.0 mln
+34.0 mln
5.57%
jan 1, 2012
791.0 mln
+147.0 mln
22.83%
jan 1, 2013
903.0 mln
+112.0 mln
14.16%
jan 1, 2014
1.148 bln
+245.0 mln
27.13%
jan 1, 2015
1.062 bln
-86.0 mln
-7.49%
Ranking of countries by current statistics by years


Comments: