29
/
en
AIzaSyAYiBZKx7MnpbEhh9jyipgxe19OcubqV5w
April 1, 2024
89453
Botswana
BWA
true
2
1
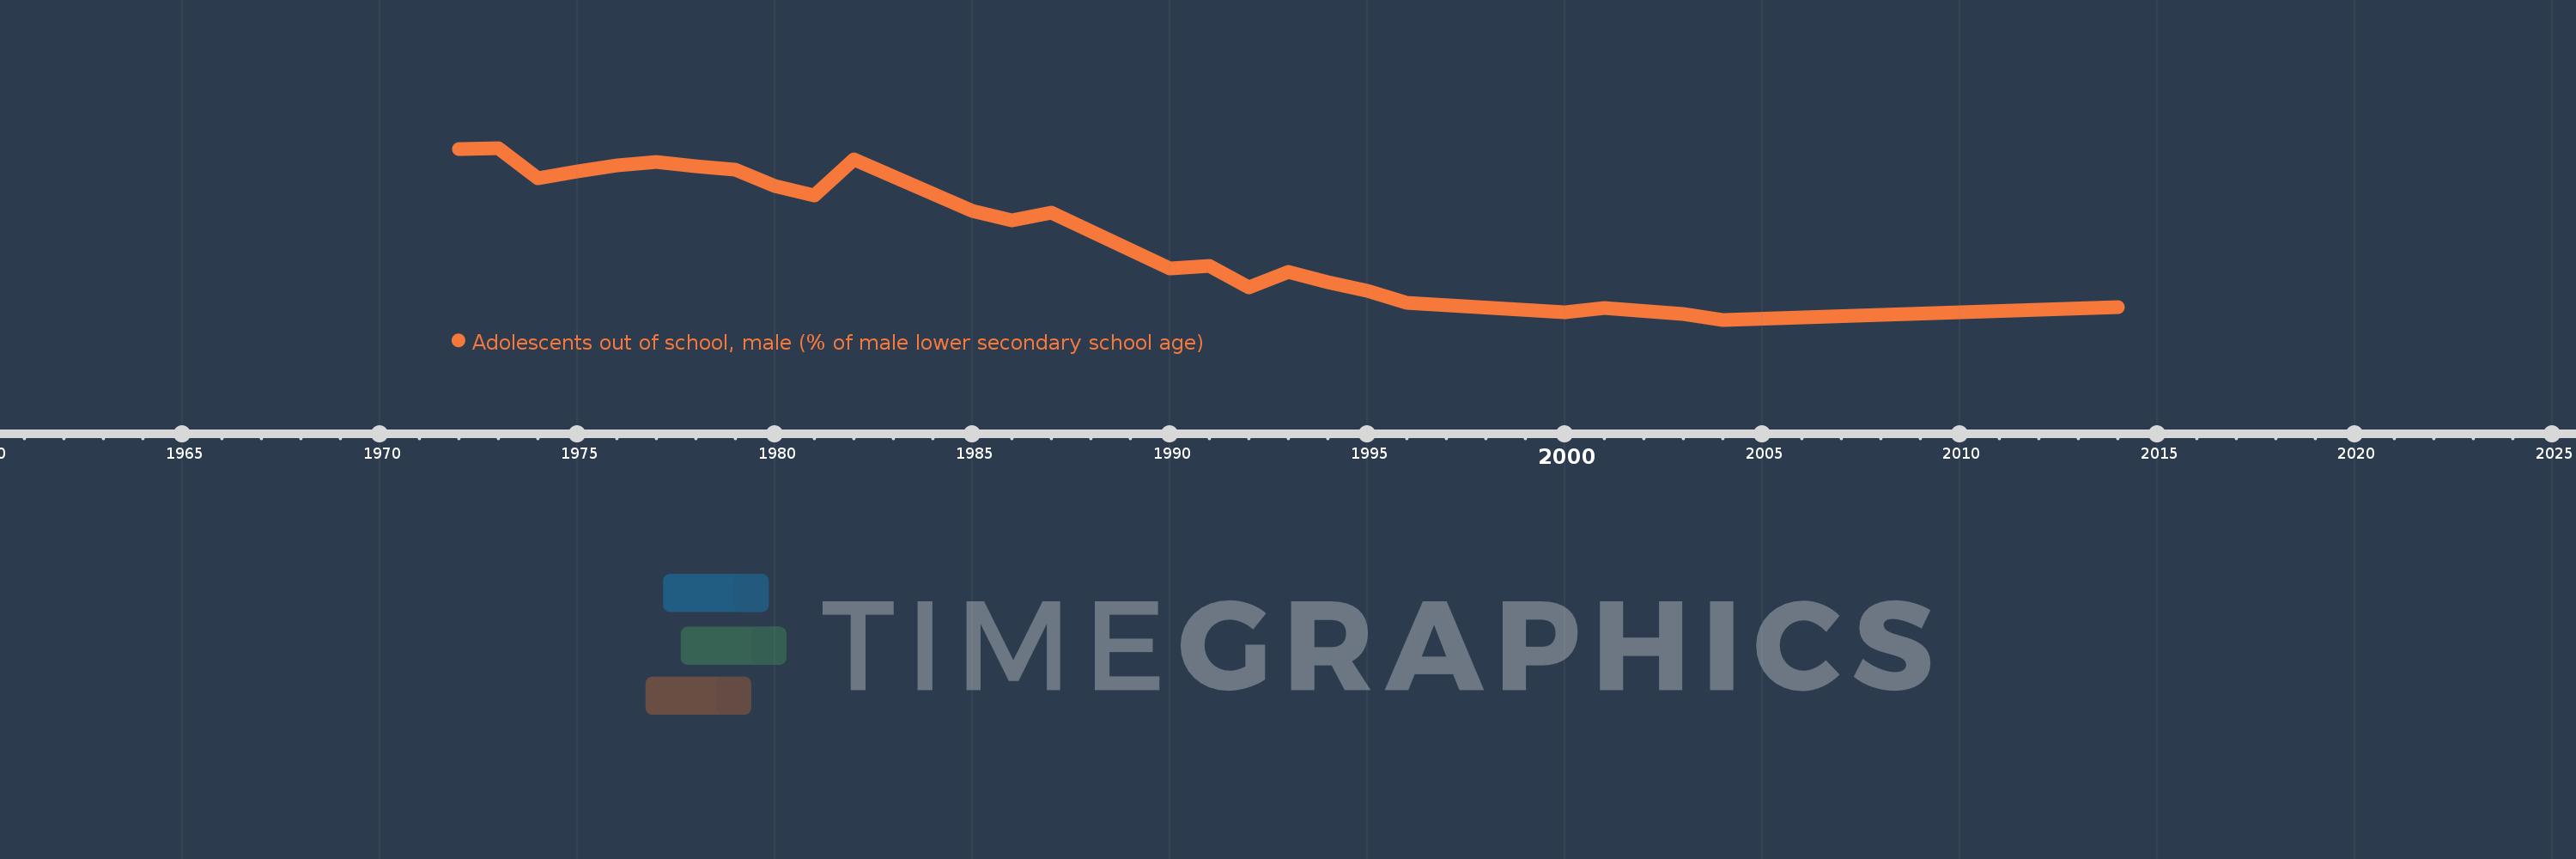
Adolescents out of school, male (% of male lower secondary school age)
2014,2004,2003,2001,2000,1996,1995,1994,1993,1992,1991,1990,1987,1986,1985,1982,1981,1980,1979,1978,1977,1976,1975,1974,1973,1972
This statistics in other country:
AfghanistanAlbaniaAlgeriaAngolaAntigua and BarbudaArab WorldArgentinaArmeniaArubaAustraliaAzerbaijanBahamas, TheBahrainBangladeshBarbadosBelarusBelgiumBelizeBeninBermudaBhutanBoliviaBotswanaBrazilBrunei DarussalamBulgariaBurkina FasoBurundiCabo VerdeCambodiaCameroonCanadaCaribbean small statesCentral African RepublicCentral Europe and the BalticsChadChileColombiaComorosCongo, Dem. Rep.Congo, Rep.Costa RicaCroatiaCubaCyprusDenmarkDjiboutiDominicaDominican RepublicEarly-demographic dividendEast Asia & PacificEast Asia & Pacific (excluding high income)East Asia & Pacific (IDA & IBRD countries)EcuadorEgypt, Arab Rep.El SalvadorEritreaEstoniaEthiopiaEuro areaEurope & Central AsiaEurope & Central Asia (excluding high income)Europe & Central Asia (IDA & IBRD countries)European UnionFijiFinlandFragile and conflict affected situationsFranceGambia, TheGeorgiaGhanaGreeceGrenadaGuatemalaGuineaGuinea-BissauGuyanaHeavily indebted poor countries (HIPC)High incomeHondurasHong Kong SAR, ChinaHungaryIBRD onlyIcelandIDA & IBRD totalIDA blendIDA onlyIDA totalIndiaIndonesiaIran, Islamic Rep.IraqIrelandItalyJamaicaJordanKazakhstanKenyaKiribatiKorea, Rep.KuwaitKyrgyz RepublicLao PDRLate-demographic dividendLatin America & Caribbean Latin America & Caribbean (excluding high income)Latin America & the Caribbean (IDA & IBRD countries)LatviaLeast developed countries: UN classificationLebanonLesothoLibyaLiechtensteinLithuaniaLow & middle incomeLow incomeLower middle incomeLuxembourgMacao SAR, ChinaMacedonia, FYRMadagascarMalawiMaldivesMaliMaltaMauritaniaMauritiusMexicoMiddle East & North AfricaMiddle East & North Africa (excluding high income)Middle East & North Africa (IDA & IBRD countries)Middle incomeMoldovaMongoliaMoroccoMozambiqueMyanmarNamibiaNauruNetherlandsNew ZealandNicaraguaNigerNorth AmericaNorwayOECD membersOmanOther small statesPacific island small statesPakistanPanamaParaguayPeruPhilippinesPolandPortugalPost-demographic dividendPre-demographic dividendPuerto RicoQatarRomaniaRussian FederationSamoaSao Tome and PrincipeSaudi ArabiaSenegalSerbiaSeychellesSierra LeoneSloveniaSmall statesSolomon IslandsSomaliaSouth AfricaSouth AsiaSouth Asia (IDA & IBRD)SpainSri LankaSt. Kitts and NevisSt. LuciaSt. Vincent and the GrenadinesSub-Saharan Africa Sub-Saharan Africa (excluding high income)Sub-Saharan Africa (IDA & IBRD countries)SudanSurinameSwazilandSwedenSwitzerlandSyrian Arab RepublicTajikistanThailandTimor-LesteTogoTongaTrinidad and TobagoTunisiaTurkeyTuvaluUgandaUkraineUnited Arab EmiratesUnited KingdomUnited StatesUpper middle incomeUruguayVanuatuVenezuela, RBWest Bank and GazaWorldYemen, Rep.Zimbabwe Timeline:
This timeline shows a graph from 1972 to 2014 of Botswana. No data until 1971. Number of actual observations by date: 26.
Source name:
World Development Indicators
Source organization:
United Nations Educational, Scientific, and Cultural Organization (UNESCO) Institute for Statistics.
Categories, topics:
Education
Last updated:
apr 23, 2017
Indicators value changes by year
Maximum:
68.709
jan 1, 1973
At the date of observation
Value
Absolute change
Change from previous value
jan 1, 1972
68.166
+68.166
0.0%
jan 1, 1973
68.709
+0.543
0.8%
jan 1, 1974
58.095
-10.614
-15.45%
jan 1, 1975
60.305
+2.21
3.8%
jan 1, 1976
62.485
+2.18
3.61%
jan 1, 1977
63.703
+1.218
1.95%
jan 1, 1978
62.139
-1.564
-2.45%
jan 1, 1979
60.902
-1.237
-1.99%
jan 1, 1980
55.373
-5.528
-9.08%
jan 1, 1981
51.94
-3.433
-6.2%
jan 1, 1982
64.535
+12.595
24.25%
jan 1, 1985
46.294
-18.242
-28.27%
jan 1, 1986
43.112
-3.182
-6.87%
jan 1, 1987
45.69
+2.578
5.98%
jan 1, 1990
25.973
-19.718
-43.16%
jan 1, 1991
27.098
+1.125
4.33%
jan 1, 1992
19.23
-7.868
-29.04%
jan 1, 1993
24.902
+5.672
29.49%
jan 1, 1994
21.329
-3.573
-14.35%
jan 1, 1995
18.087
-3.242
-15.2%
jan 1, 1996
13.795
-4.292
-23.73%
jan 1, 2000
10.455
-3.34
-24.21%
jan 1, 2001
12.192
+1.736
16.6%
jan 1, 2003
9.892
-2.3
-18.86%
jan 1, 2004
7.892
-2.0
-20.22%
jan 1, 2014
12.28
+4.388
55.61%
Ranking of countries by current statistics by years


Comments: