29
/
en
AIzaSyAYiBZKx7MnpbEhh9jyipgxe19OcubqV5w
April 1, 2024
115556
Cuba
CUB
true
2
1
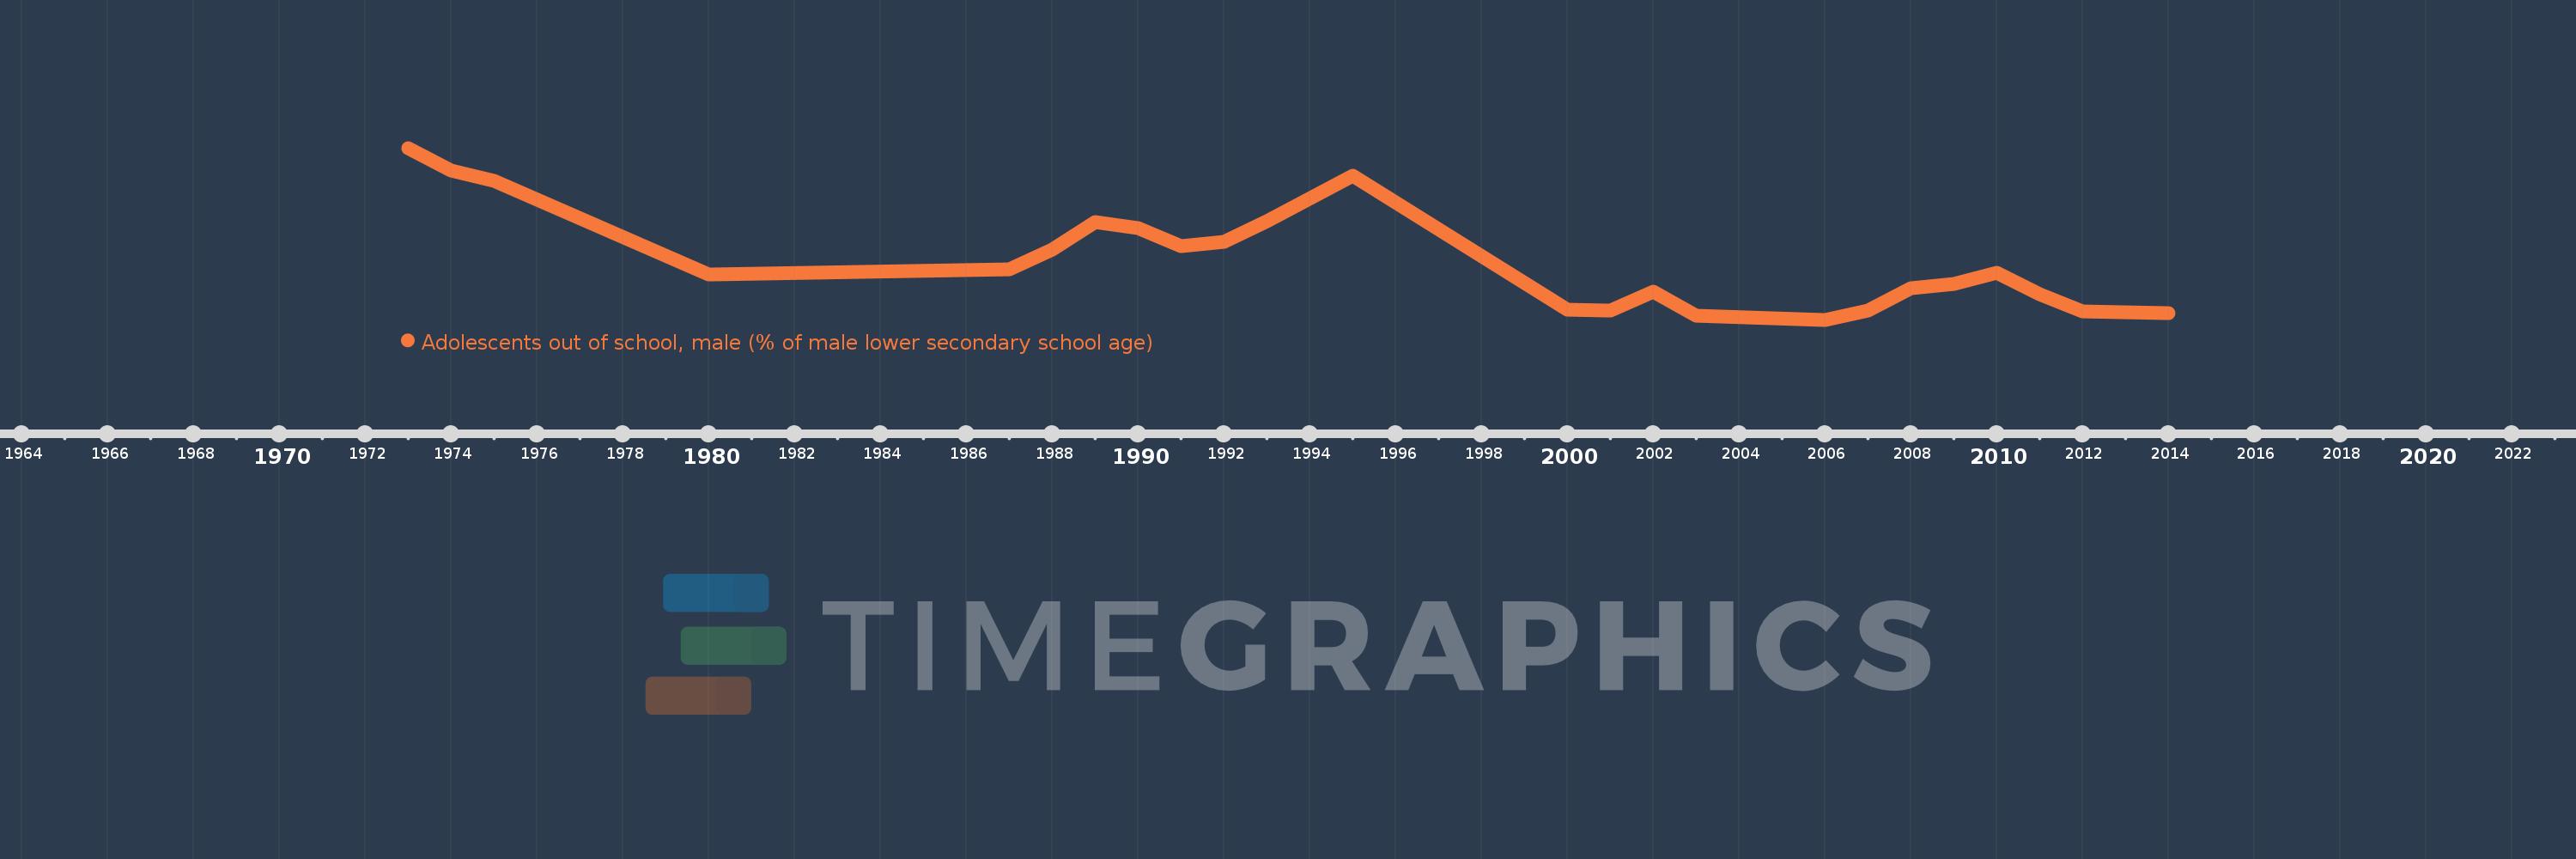
Adolescents out of school, male (% of male lower secondary school age)
2014,2012,2011,2010,2009,2008,2007,2006,2003,2002,2001,2000,1995,1993,1992,1991,1990,1989,1988,1987,1980,1975,1974,1973
This statistics in other country:
AfghanistanAlbaniaAlgeriaAngolaAntigua and BarbudaArab WorldArgentinaArmeniaArubaAustraliaAzerbaijanBahamas, TheBahrainBangladeshBarbadosBelarusBelgiumBelizeBeninBermudaBhutanBoliviaBotswanaBrazilBrunei DarussalamBulgariaBurkina FasoBurundiCabo VerdeCambodiaCameroonCanadaCaribbean small statesCentral African RepublicCentral Europe and the BalticsChadChileColombiaComorosCongo, Dem. Rep.Congo, Rep.Costa RicaCroatiaCubaCyprusDenmarkDjiboutiDominicaDominican RepublicEarly-demographic dividendEast Asia & PacificEast Asia & Pacific (excluding high income)East Asia & Pacific (IDA & IBRD countries)EcuadorEgypt, Arab Rep.El SalvadorEritreaEstoniaEthiopiaEuro areaEurope & Central AsiaEurope & Central Asia (excluding high income)Europe & Central Asia (IDA & IBRD countries)European UnionFijiFinlandFragile and conflict affected situationsFranceGambia, TheGeorgiaGhanaGreeceGrenadaGuatemalaGuineaGuinea-BissauGuyanaHeavily indebted poor countries (HIPC)High incomeHondurasHong Kong SAR, ChinaHungaryIBRD onlyIcelandIDA & IBRD totalIDA blendIDA onlyIDA totalIndiaIndonesiaIran, Islamic Rep.IraqIrelandItalyJamaicaJordanKazakhstanKenyaKiribatiKorea, Rep.KuwaitKyrgyz RepublicLao PDRLate-demographic dividendLatin America & Caribbean Latin America & Caribbean (excluding high income)Latin America & the Caribbean (IDA & IBRD countries)LatviaLeast developed countries: UN classificationLebanonLesothoLibyaLiechtensteinLithuaniaLow & middle incomeLow incomeLower middle incomeLuxembourgMacao SAR, ChinaMacedonia, FYRMadagascarMalawiMaldivesMaliMaltaMauritaniaMauritiusMexicoMiddle East & North AfricaMiddle East & North Africa (excluding high income)Middle East & North Africa (IDA & IBRD countries)Middle incomeMoldovaMongoliaMoroccoMozambiqueMyanmarNamibiaNauruNetherlandsNew ZealandNicaraguaNigerNorth AmericaNorwayOECD membersOmanOther small statesPacific island small statesPakistanPanamaParaguayPeruPhilippinesPolandPortugalPost-demographic dividendPre-demographic dividendPuerto RicoQatarRomaniaRussian FederationSamoaSao Tome and PrincipeSaudi ArabiaSenegalSerbiaSeychellesSierra LeoneSloveniaSmall statesSolomon IslandsSomaliaSouth AfricaSouth AsiaSouth Asia (IDA & IBRD)SpainSri LankaSt. Kitts and NevisSt. LuciaSt. Vincent and the GrenadinesSub-Saharan Africa Sub-Saharan Africa (excluding high income)Sub-Saharan Africa (IDA & IBRD countries)SudanSurinameSwazilandSwedenSwitzerlandSyrian Arab RepublicTajikistanThailandTimor-LesteTogoTongaTrinidad and TobagoTunisiaTurkeyTuvaluUgandaUkraineUnited Arab EmiratesUnited KingdomUnited StatesUpper middle incomeUruguayVanuatuVenezuela, RBWest Bank and GazaWorldYemen, Rep.Zimbabwe Timeline:
This timeline shows a graph from 1973 to 2014 of Cuba. No data until 1972. Number of actual observations by date: 24.
Source name:
World Development Indicators
Source organization:
United Nations Educational, Scientific, and Cultural Organization (UNESCO) Institute for Statistics.
Categories, topics:
Education
Last updated:
apr 23, 2017
Indicators value changes by year
Maximum:
26.826
jan 1, 1973
At the date of observation
Value
Absolute change
Change from previous value
jan 1, 1973
26.826
+26.826
0.0%
jan 1, 1974
23.506
-3.32
-12.38%
jan 1, 1975
22.001
-1.505
-6.4%
jan 1, 1980
8.121
-13.88
-63.09%
jan 1, 1987
8.812
+0.692
8.52%
jan 1, 1988
11.722
+2.91
33.02%
jan 1, 1989
15.793
+4.071
34.73%
jan 1, 1990
14.94
-0.853
-5.4%
jan 1, 1991
12.248
-2.692
-18.02%
jan 1, 1992
12.928
+0.679
5.55%
jan 1, 1993
15.947
+3.019
23.35%
jan 1, 1995
22.653
+6.706
42.05%
jan 1, 2000
2.833
-19.82
-87.5%
jan 1, 2001
2.774
-0.059
-2.07%
jan 1, 2002
5.513
+2.74
98.76%
jan 1, 2003
1.936
-3.578
-64.89%
jan 1, 2006
1.366
-0.569
-29.4%
jan 1, 2007
2.683
+1.317
96.35%
jan 1, 2008
6.092
+3.409
127.05%
jan 1, 2009
6.633
+0.542
8.89%
jan 1, 2010
8.266
+1.633
24.62%
jan 1, 2011
5.124
-3.142
-38.01%
jan 1, 2012
2.644
-2.48
-48.39%
jan 1, 2014
2.401
-0.244
-9.21%
Ranking of countries by current statistics by years


Comments: