30
/
AIzaSyAYiBZKx7MnpbEhh9jyipgxe19OcubqV5w
April 1, 2024
202518
Mozambique
MOZ
true
2
1
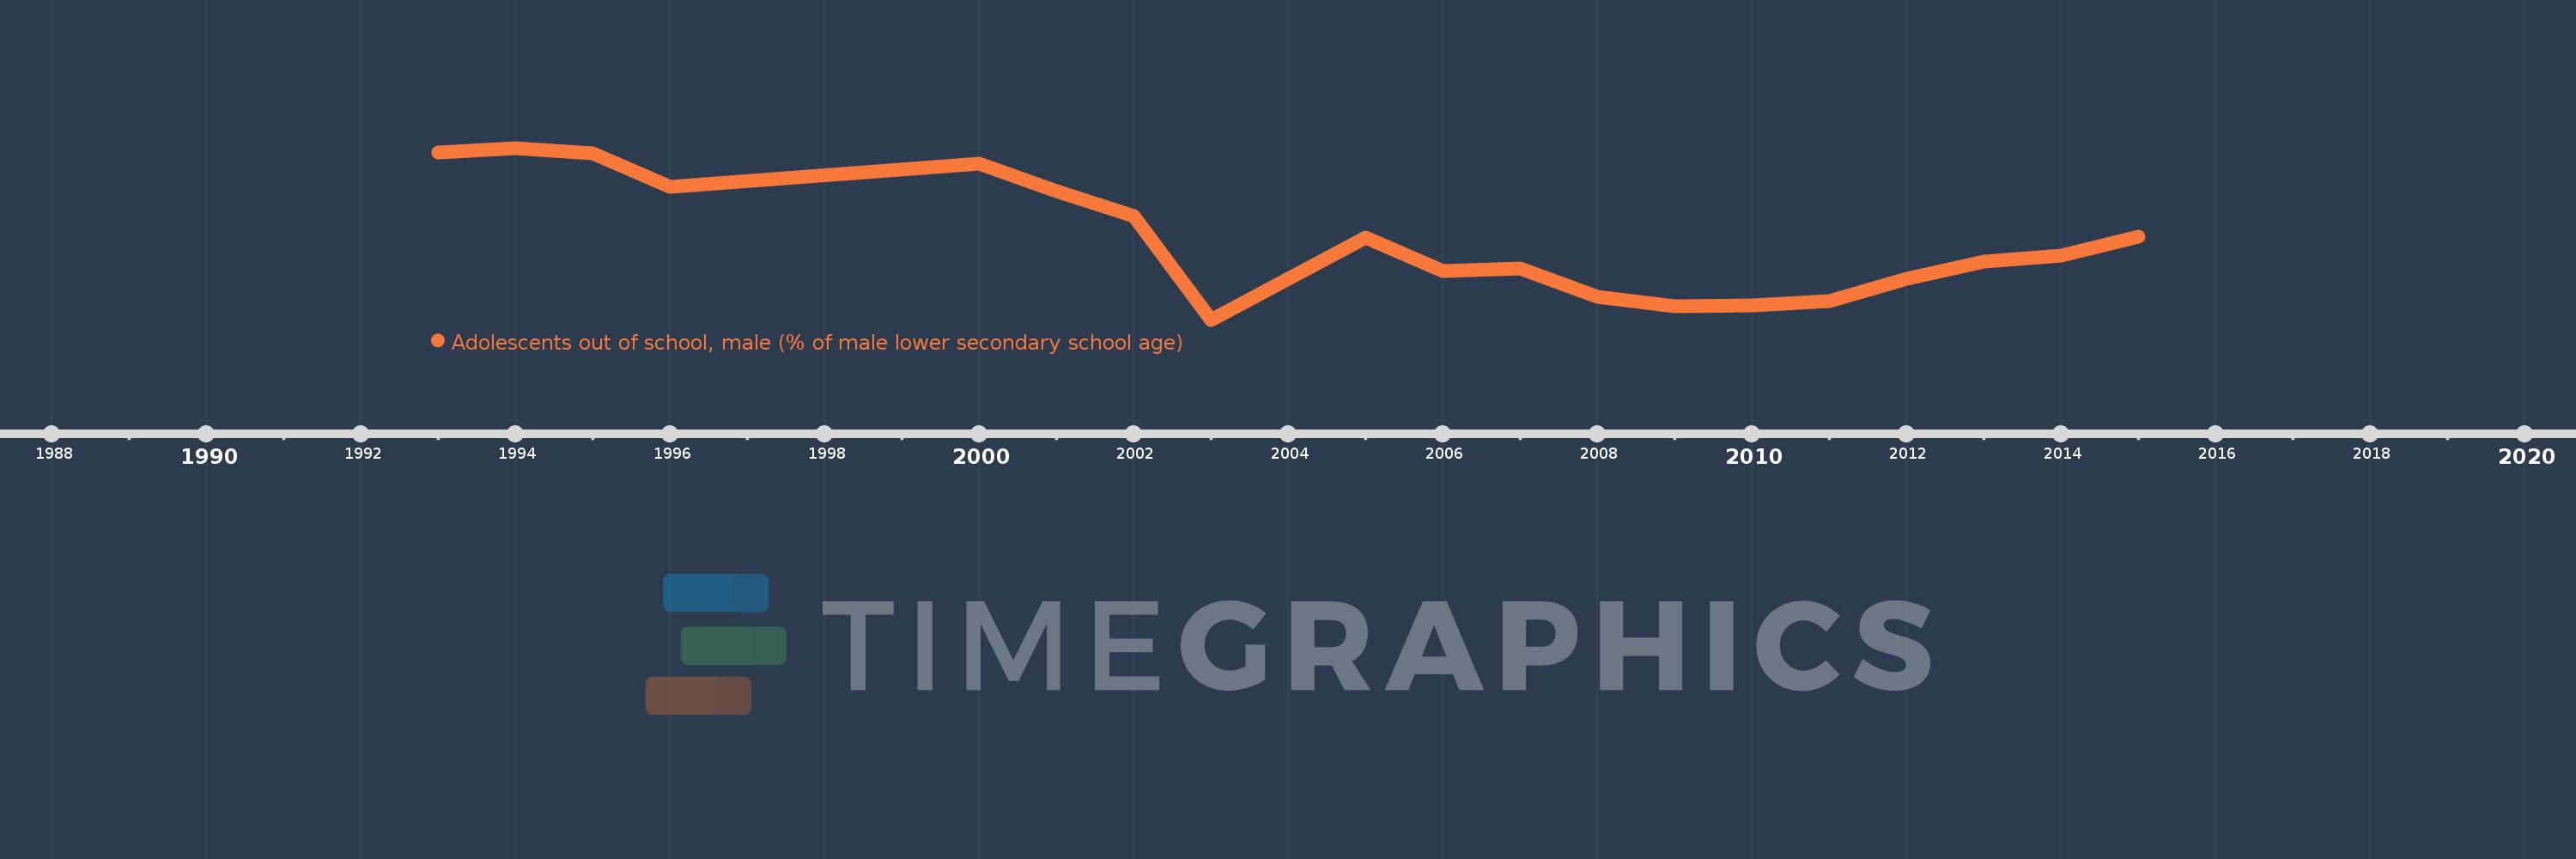
Adolescents out of school, male (% of male lower secondary school age)
2015,2014,2013,2012,2011,2010,2009,2008,2007,2006,2005,2003,2002,2001,2000,1996,1995,1994,1993
