29
/
en
AIzaSyAYiBZKx7MnpbEhh9jyipgxe19OcubqV5w
April 1, 2024
207653
Netherlands
NLD
true
2
1
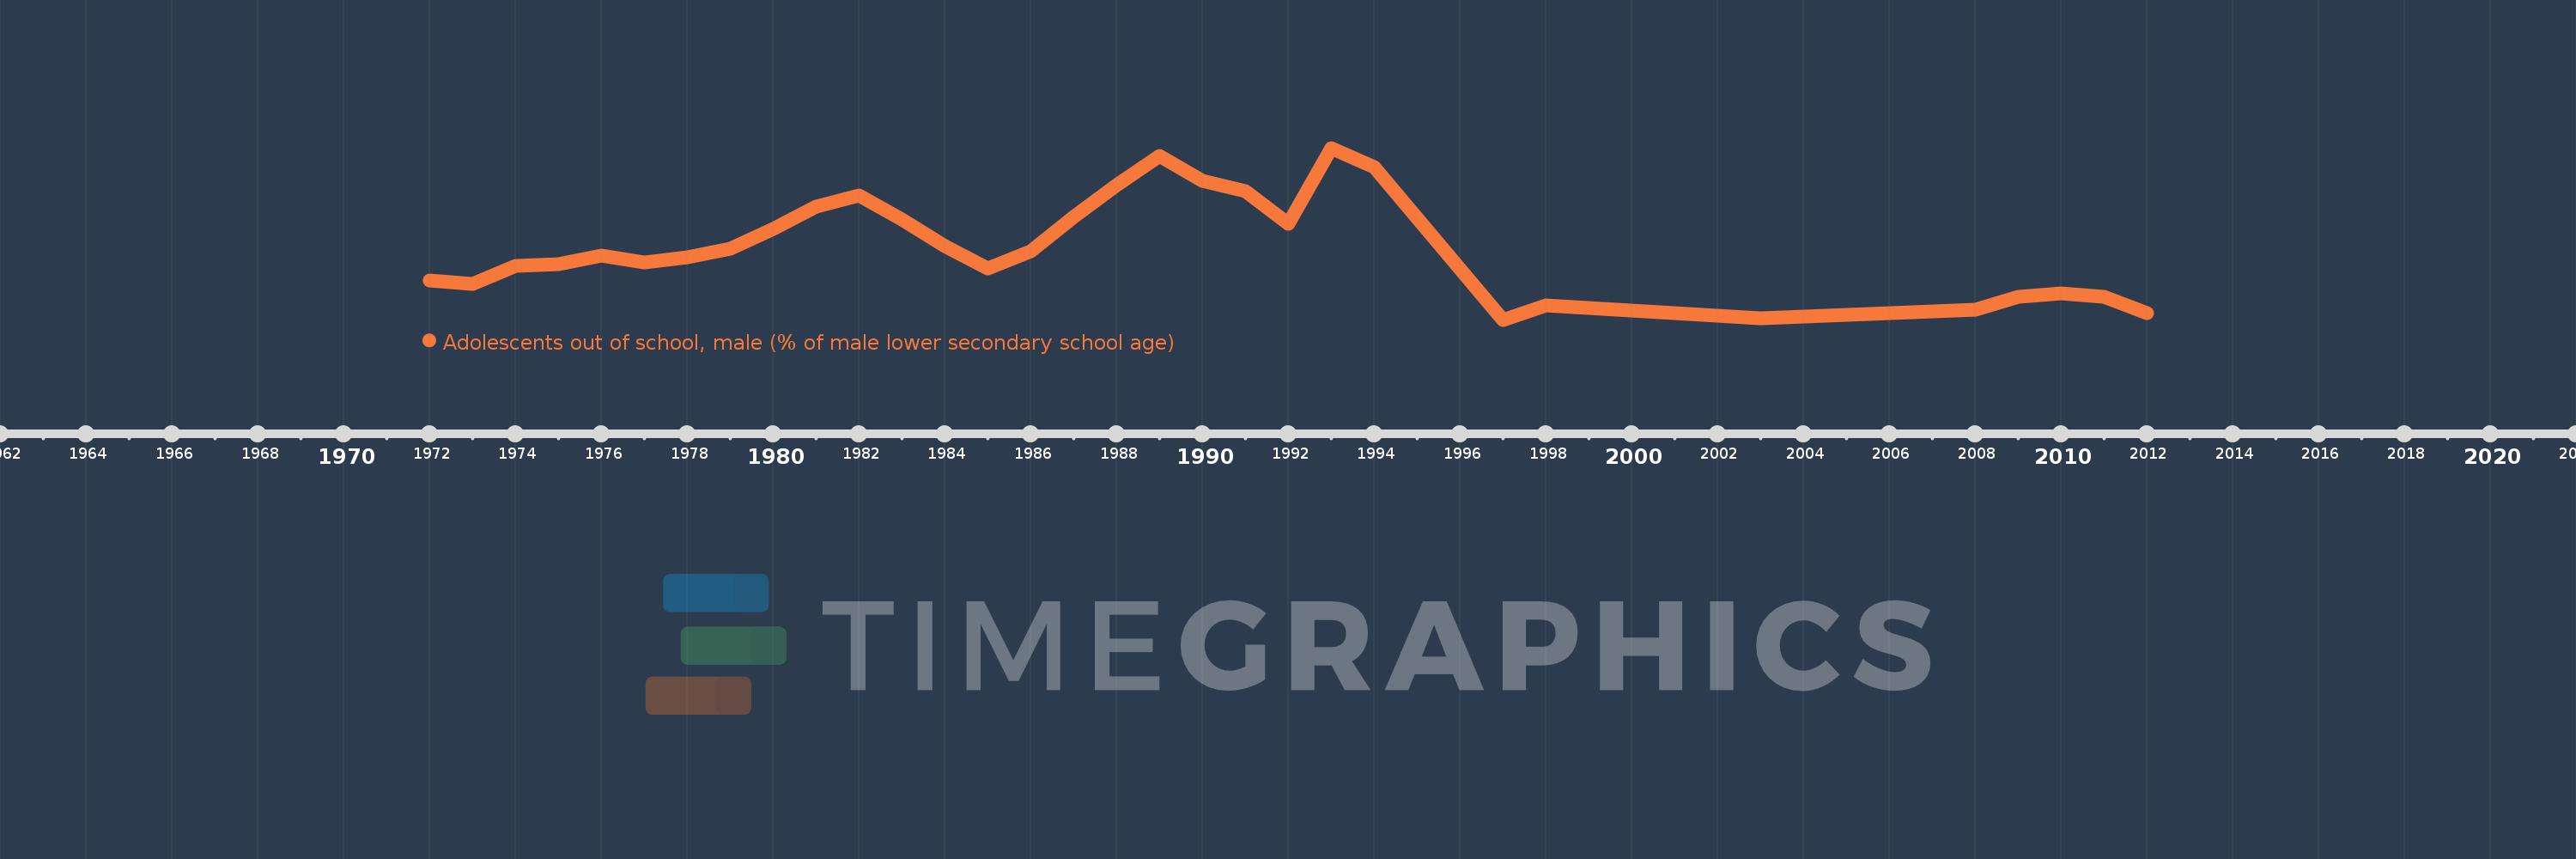
Adolescents out of school, male (% of male lower secondary school age)
2012,2011,2010,2009,2008,2003,1998,1997,1994,1993,1992,1991,1990,1989,1988,1987,1986,1985,1984,1983,1982,1981,1980,1979,1978,1977,1976,1975,1974,1973,1972
This statistics in other country:
AfghanistanAlbaniaAlgeriaAngolaAntigua and BarbudaArab WorldArgentinaArmeniaArubaAustraliaAzerbaijanBahamas, TheBahrainBangladeshBarbadosBelarusBelgiumBelizeBeninBermudaBhutanBoliviaBotswanaBrazilBrunei DarussalamBulgariaBurkina FasoBurundiCabo VerdeCambodiaCameroonCanadaCaribbean small statesCentral African RepublicCentral Europe and the BalticsChadChileColombiaComorosCongo, Dem. Rep.Congo, Rep.Costa RicaCroatiaCubaCyprusDenmarkDjiboutiDominicaDominican RepublicEarly-demographic dividendEast Asia & PacificEast Asia & Pacific (excluding high income)East Asia & Pacific (IDA & IBRD countries)EcuadorEgypt, Arab Rep.El SalvadorEritreaEstoniaEthiopiaEuro areaEurope & Central AsiaEurope & Central Asia (excluding high income)Europe & Central Asia (IDA & IBRD countries)European UnionFijiFinlandFragile and conflict affected situationsFranceGambia, TheGeorgiaGhanaGreeceGrenadaGuatemalaGuineaGuinea-BissauGuyanaHeavily indebted poor countries (HIPC)High incomeHondurasHong Kong SAR, ChinaHungaryIBRD onlyIcelandIDA & IBRD totalIDA blendIDA onlyIDA totalIndiaIndonesiaIran, Islamic Rep.IraqIrelandItalyJamaicaJordanKazakhstanKenyaKiribatiKorea, Rep.KuwaitKyrgyz RepublicLao PDRLate-demographic dividendLatin America & Caribbean Latin America & Caribbean (excluding high income)Latin America & the Caribbean (IDA & IBRD countries)LatviaLeast developed countries: UN classificationLebanonLesothoLibyaLiechtensteinLithuaniaLow & middle incomeLow incomeLower middle incomeLuxembourgMacao SAR, ChinaMacedonia, FYRMadagascarMalawiMaldivesMaliMaltaMauritaniaMauritiusMexicoMiddle East & North AfricaMiddle East & North Africa (excluding high income)Middle East & North Africa (IDA & IBRD countries)Middle incomeMoldovaMongoliaMoroccoMozambiqueMyanmarNamibiaNauruNetherlandsNew ZealandNicaraguaNigerNorth AmericaNorwayOECD membersOmanOther small statesPacific island small statesPakistanPanamaParaguayPeruPhilippinesPolandPortugalPost-demographic dividendPre-demographic dividendPuerto RicoQatarRomaniaRussian FederationSamoaSao Tome and PrincipeSaudi ArabiaSenegalSerbiaSeychellesSierra LeoneSloveniaSmall statesSolomon IslandsSomaliaSouth AfricaSouth AsiaSouth Asia (IDA & IBRD)SpainSri LankaSt. Kitts and NevisSt. LuciaSt. Vincent and the GrenadinesSub-Saharan Africa Sub-Saharan Africa (excluding high income)Sub-Saharan Africa (IDA & IBRD countries)SudanSurinameSwazilandSwedenSwitzerlandSyrian Arab RepublicTajikistanThailandTimor-LesteTogoTongaTrinidad and TobagoTunisiaTurkeyTuvaluUgandaUkraineUnited Arab EmiratesUnited KingdomUnited StatesUpper middle incomeUruguayVanuatuVenezuela, RBWest Bank and GazaWorldYemen, Rep.Zimbabwe Timeline:
This timeline shows a graph from 1972 to 2012 of Netherlands. No data until 1971. Number of actual observations by date: 31.
Source name:
World Development Indicators
Source organization:
United Nations Educational, Scientific, and Cultural Organization (UNESCO) Institute for Statistics.
Categories, topics:
Education
Last updated:
apr 23, 2017
Indicators value changes by year
At the date of observation
Value
Absolute change
Change from previous value
jan 1, 1972
3.234
+3.234
0.0%
jan 1, 1973
2.984
-0.25
-7.73%
jan 1, 1974
4.414
+1.43
47.93%
jan 1, 1975
4.529
+0.115
2.6%
jan 1, 1976
5.265
+0.736
16.25%
jan 1, 1977
4.656
-0.608
-11.56%
jan 1, 1978
5.118
+0.462
9.92%
jan 1, 1979
5.807
+0.689
13.46%
jan 1, 1980
7.383
+1.576
27.14%
jan 1, 1981
9.152
+1.769
23.95%
jan 1, 1982
10.079
+0.927
10.13%
jan 1, 1983
8.125
-1.955
-19.39%
jan 1, 1984
5.99
-2.135
-26.28%
jan 1, 1985
4.185
-1.805
-30.13%
jan 1, 1986
5.606
+1.422
33.97%
jan 1, 1987
8.345
+2.738
48.84%
jan 1, 1988
10.877
+2.532
30.34%
jan 1, 1989
13.212
+2.336
21.47%
jan 1, 1990
11.243
-1.969
-14.9%
jan 1, 1991
10.426
-0.817
-7.27%
jan 1, 1992
7.765
-2.661
-25.52%
jan 1, 1993
13.87
+6.105
78.62%
jan 1, 1994
12.335
-1.535
-11.07%
jan 1, 1997
0.092
-12.243
-99.25%
jan 1, 1998
1.222
+1.13
1.22K%
jan 1, 2003
0.198
-1.024
-83.77%
jan 1, 2008
0.882
+0.684
344.73%
jan 1, 2009
1.928
+1.046
118.52%
jan 1, 2010
2.198
+0.27
14.01%
jan 1, 2011
1.902
-0.297
-13.51%
jan 1, 2012
0.6
-1.301
-68.43%
Ranking of countries by current statistics by years


Comments: