29
/
en
AIzaSyAYiBZKx7MnpbEhh9jyipgxe19OcubqV5w
April 1, 2024
88055
Bolivia
BOL
true
2
1
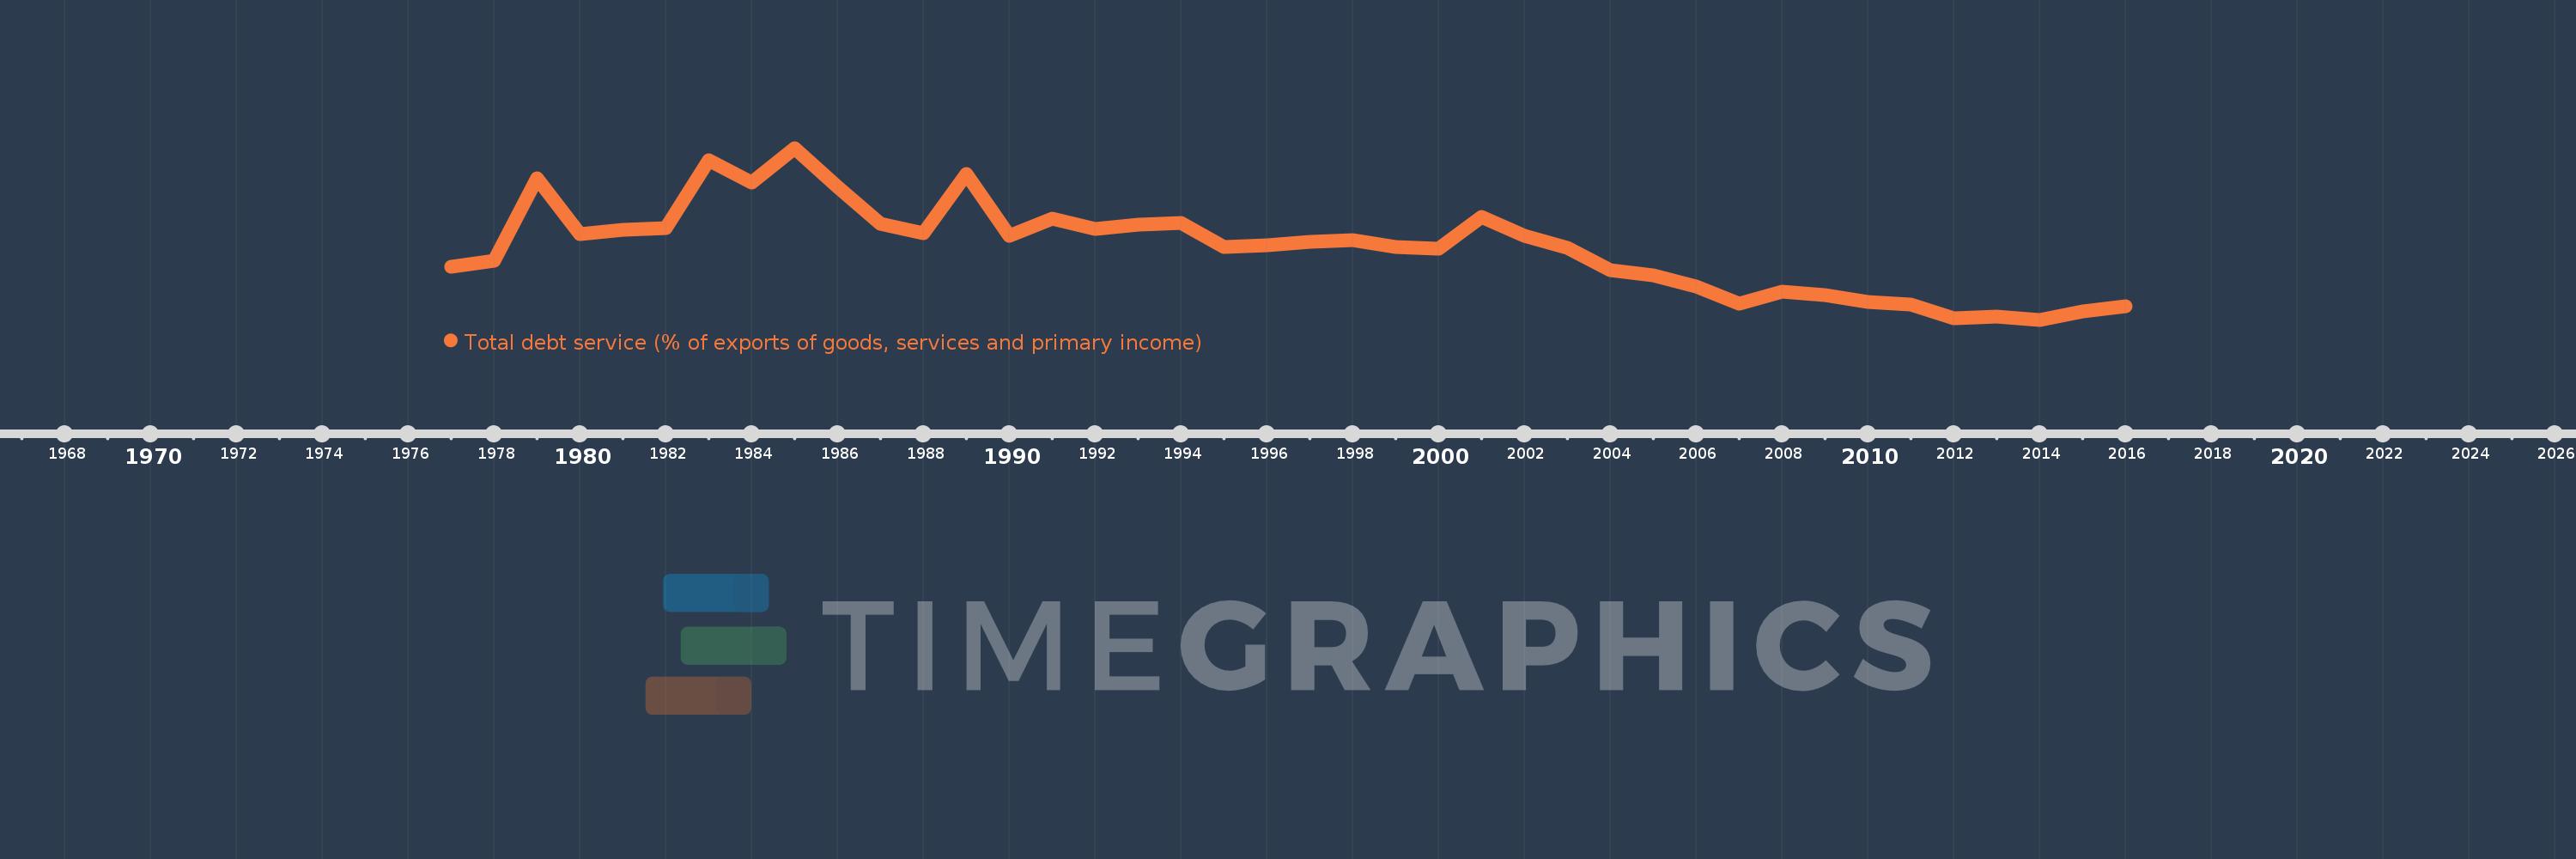
Total debt service (% of exports of goods, services and primary income)
2016,2015,2014,2013,2012,2011,2010,2009,2008,2007,2006,2005,2004,2003,2002,2001,2000,1999,1998,1997,1996,1995,1994,1993,1992,1991,1990,1989,1988,1987,1986,1985,1984,1983,1982,1981,1980,1979,1978,1977
This statistics in other country:
Timeline:
This timeline shows a graph from 1977 to 2016 of Bolivia. No data until 1976. Number of actual observations by date: 40.
Source name:
World Development Indicators
Source organization:
World Bank, International Debt Statistics.
Categories, topics:
Economy & Growth, External Debt
Last updated:
apr 23, 2017
Indicators value changes by year
Maximum:
63.881
jan 1, 1985
At the date of observation
Value
Absolute change
Change from previous value
jan 1, 1977
22.569
+22.569
0.0%
jan 1, 1978
24.84
+2.271
10.06%
jan 1, 1979
53.459
+28.619
115.21%
jan 1, 1980
34.109
-19.35
-36.2%
jan 1, 1981
35.46
+1.351
3.96%
jan 1, 1982
36.21
+0.75
2.11%
jan 1, 1983
59.749
+23.539
65.01%
jan 1, 1984
51.86
-7.889
-13.2%
jan 1, 1985
63.881
+12.02
23.18%
jan 1, 1986
50.298
-13.583
-21.26%
jan 1, 1987
37.448
-12.851
-25.55%
jan 1, 1988
34.335
-3.113
-8.31%
jan 1, 1989
54.93
+20.595
59.98%
jan 1, 1990
33.502
-21.428
-39.01%
jan 1, 1991
39.368
+5.866
17.51%
jan 1, 1992
35.722
-3.646
-9.26%
jan 1, 1993
37.25
+1.528
4.28%
jan 1, 1994
37.894
+0.644
1.73%
jan 1, 1995
29.535
-8.359
-22.06%
jan 1, 1996
29.962
+0.427
1.45%
jan 1, 1997
31.222
+1.26
4.2%
jan 1, 1998
31.852
+0.63
2.02%
jan 1, 1999
29.617
-2.235
-7.02%
jan 1, 2000
28.913
-0.704
-2.38%
jan 1, 2001
39.843
+10.931
37.81%
jan 1, 2002
33.524
-6.319
-15.86%
jan 1, 2003
29.109
-4.415
-13.17%
jan 1, 2004
21.396
-7.713
-26.5%
jan 1, 2005
19.757
-1.639
-7.66%
jan 1, 2006
15.651
-4.106
-20.78%
jan 1, 2007
9.687
-5.964
-38.11%
jan 1, 2008
13.946
+4.259
43.96%
jan 1, 2009
12.892
-1.053
-7.55%
jan 1, 2010
10.315
-2.577
-19.99%
jan 1, 2011
9.47
-0.845
-8.2%
jan 1, 2012
4.814
-4.655
-49.16%
jan 1, 2013
5.229
+0.415
8.61%
jan 1, 2014
4.254
-0.974
-18.63%
jan 1, 2015
7.023
+2.768
65.07%
jan 1, 2016
8.95
+1.927
27.45%
Ranking of countries by current statistics by years


Comments: