29
/
en
AIzaSyAYiBZKx7MnpbEhh9jyipgxe19OcubqV5w
April 1, 2024
141210
Ghana
GHA
true
2
1
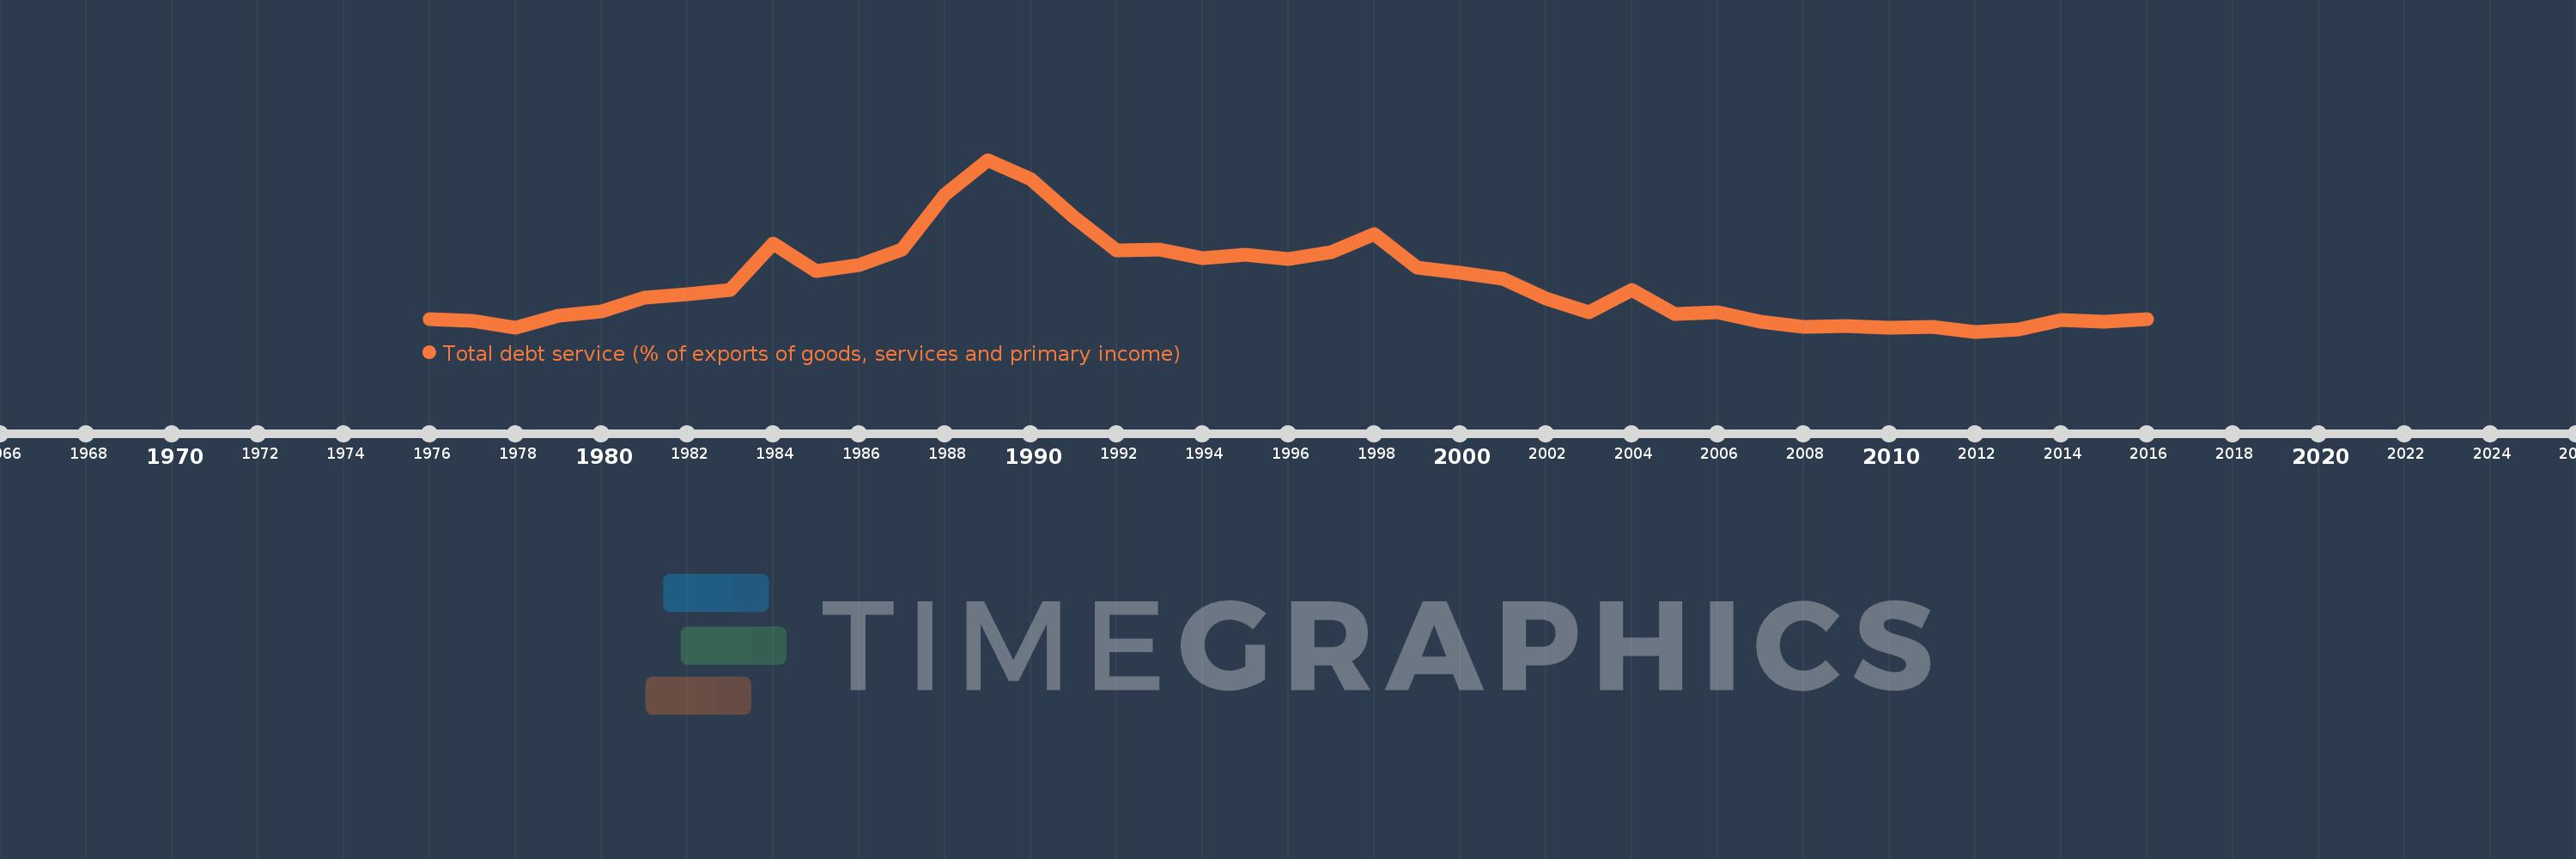
Total debt service (% of exports of goods, services and primary income)
2016,2015,2014,2013,2012,2011,2010,2009,2008,2007,2006,2005,2004,2003,2002,2001,2000,1999,1998,1997,1996,1995,1994,1993,1992,1991,1990,1989,1988,1987,1986,1985,1984,1983,1982,1981,1980,1979,1978,1977,1976
This statistics in other country:
Timeline:
This timeline shows a graph from 1976 to 2016 of Ghana. No data until 1975. Number of actual observations by date: 41.
Source name:
World Development Indicators
Source organization:
World Bank, International Debt Statistics.
Categories, topics:
Economy & Growth, External Debt
Last updated:
apr 23, 2017
Indicators value changes by year
Maximum:
56.917
jan 1, 1989
At the date of observation
Value
Absolute change
Change from previous value
jan 1, 1976
6.486
+6.486
0.0%
jan 1, 1977
5.809
-0.677
-10.44%
jan 1, 1978
3.715
-2.094
-36.04%
jan 1, 1979
7.414
+3.699
99.57%
jan 1, 1980
8.895
+1.481
19.97%
jan 1, 1981
13.111
+4.216
47.4%
jan 1, 1982
14.251
+1.14
8.69%
jan 1, 1983
15.557
+1.306
9.16%
jan 1, 1984
30.411
+14.854
95.49%
jan 1, 1985
21.721
-8.69
-28.58%
jan 1, 1986
23.579
+1.858
8.56%
jan 1, 1987
28.324
+4.744
20.12%
jan 1, 1988
45.802
+17.479
61.71%
jan 1, 1989
56.917
+11.115
24.27%
jan 1, 1990
50.771
-6.147
-10.8%
jan 1, 1991
38.791
-11.98
-23.6%
jan 1, 1992
28.134
-10.657
-27.47%
jan 1, 1993
28.352
+0.218
0.77%
jan 1, 1994
25.638
-2.713
-9.57%
jan 1, 1995
26.69
+1.052
4.1%
jan 1, 1996
25.438
-1.252
-4.69%
jan 1, 1997
27.569
+2.131
8.38%
jan 1, 1998
33.247
+5.678
20.59%
jan 1, 1999
22.761
-10.486
-31.54%
jan 1, 2000
21.146
-1.615
-7.1%
jan 1, 2001
19.038
-2.108
-9.97%
jan 1, 2002
12.931
-6.107
-32.08%
jan 1, 2003
8.592
-4.338
-33.55%
jan 1, 2004
15.625
+7.033
81.85%
jan 1, 2005
8.033
-7.592
-48.59%
jan 1, 2006
8.616
+0.583
7.25%
jan 1, 2007
5.576
-3.04
-35.28%
jan 1, 2008
3.858
-1.718
-30.82%
jan 1, 2009
4.12
+0.262
6.79%
jan 1, 2010
3.755
-0.364
-8.84%
jan 1, 2011
3.992
+0.237
6.31%
jan 1, 2012
2.405
-1.587
-39.76%
jan 1, 2013
3.178
+0.773
32.15%
jan 1, 2014
6.058
+2.88
90.63%
jan 1, 2015
5.423
-0.635
-10.49%
jan 1, 2016
6.243
+0.82
15.12%
Ranking of countries by current statistics by years


Comments: