29
/
en
AIzaSyAYiBZKx7MnpbEhh9jyipgxe19OcubqV5w
April 1, 2024
39605
IDA only
IDX
false
2
1
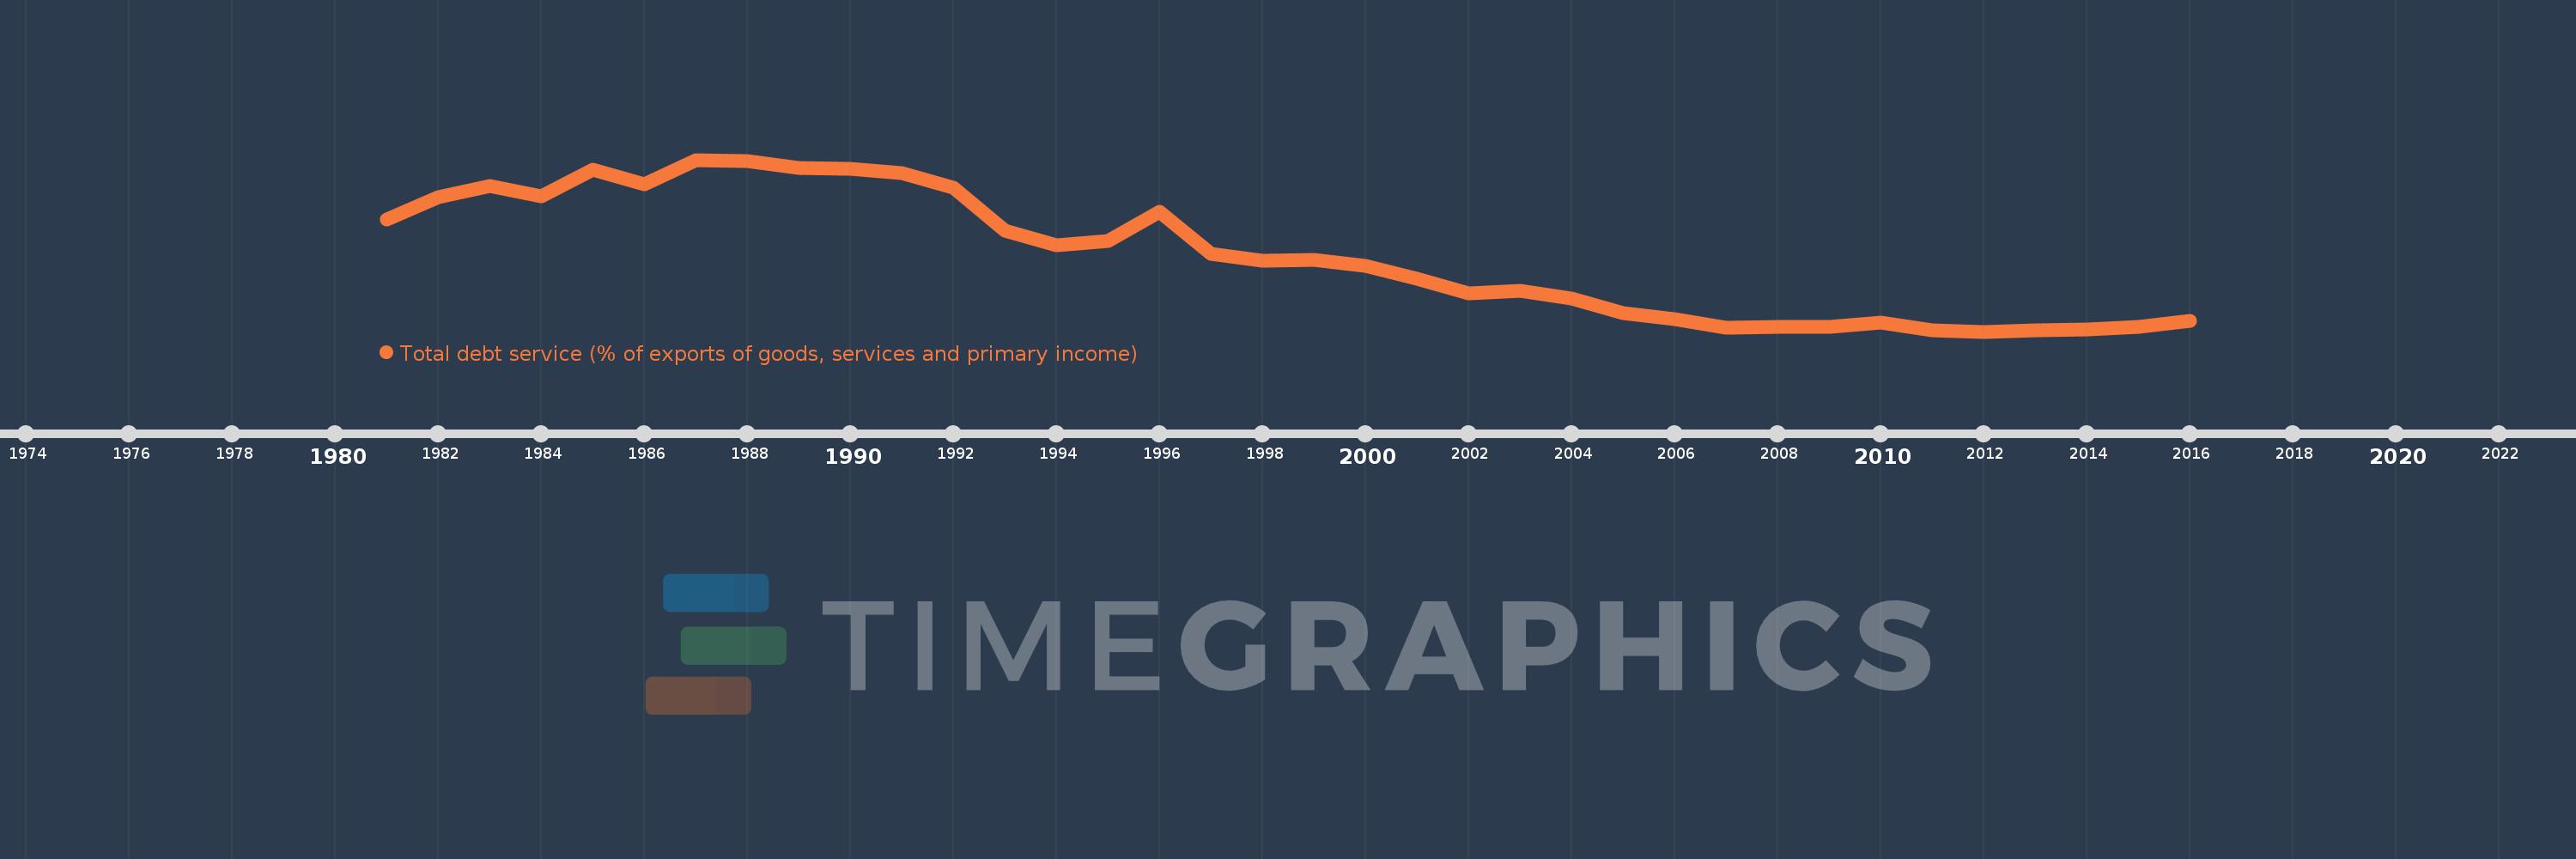
Total debt service (% of exports of goods, services and primary income)
2016,2015,2014,2013,2012,2011,2010,2009,2008,2007,2006,2005,2004,2003,2002,2001,2000,1999,1998,1997,1996,1995,1994,1993,1992,1991,1990,1989,1988,1987,1986,1985,1984,1983,1982,1981
This statistics in other country:
Timeline:
This timeline shows a graph from 1981 to 2016 of IDA only. No data until 1980. Number of actual observations by date: 36.
Source name:
World Development Indicators
Source organization:
World Bank, International Debt Statistics.
Categories, topics:
Economy & Growth, External Debt
Last updated:
apr 23, 2017
Indicators value changes by year
Maximum:
26.999
jan 1, 1987
At the date of observation
Value
Absolute change
Change from previous value
jan 1, 1981
19.234
+19.234
0.0%
jan 1, 1982
22.155
+2.92
15.18%
jan 1, 1983
23.591
+1.436
6.48%
jan 1, 1984
22.258
-1.333
-5.65%
jan 1, 1985
25.712
+3.454
15.52%
jan 1, 1986
23.77
-1.942
-7.55%
jan 1, 1987
26.999
+3.229
13.59%
jan 1, 1988
26.8
-0.199
-0.74%
jan 1, 1989
25.971
-0.829
-3.09%
jan 1, 1990
25.862
-0.109
-0.42%
jan 1, 1991
25.312
-0.55
-2.13%
jan 1, 1992
23.323
-1.99
-7.86%
jan 1, 1993
17.699
-5.624
-24.11%
jan 1, 1994
15.848
-1.851
-10.46%
jan 1, 1995
16.371
+0.523
3.3%
jan 1, 1996
20.233
+3.862
23.59%
jan 1, 1997
14.726
-5.507
-27.22%
jan 1, 1998
13.784
-0.942
-6.4%
jan 1, 1999
13.972
+0.189
1.37%
jan 1, 2000
13.154
-0.819
-5.86%
jan 1, 2001
11.499
-1.655
-12.58%
jan 1, 2002
9.515
-1.984
-17.26%
jan 1, 2003
9.847
+0.332
3.49%
jan 1, 2004
8.871
-0.976
-9.91%
jan 1, 2005
6.93
-1.94
-21.87%
jan 1, 2006
6.143
-0.788
-11.37%
jan 1, 2007
5.052
-1.091
-17.76%
jan 1, 2008
5.207
+0.155
3.07%
jan 1, 2009
5.127
-0.08
-1.54%
jan 1, 2010
5.719
+0.592
11.55%
jan 1, 2011
4.764
-0.955
-16.69%
jan 1, 2012
4.559
-0.205
-4.3%
jan 1, 2013
4.755
+0.196
4.29%
jan 1, 2014
4.791
+0.036
0.76%
jan 1, 2015
5.173
+0.382
7.98%
jan 1, 2016
5.938
+0.764
14.78%
Ranking of countries by current statistics by years


Comments: